Geotimes

Web
Extra Friday, April
19
Superplumes
across the mantle
A new method for mapping Earth's interior shows broad regions under
the Pacific Ocean and Africa where magma hotter than its surroundings is
floating through the upper mantle and then traveling horizontally under
Earth's lithosphere. Some seismologists have called these slow upwelling
regions superplumes, but primarily relegated the phenomena to the lower
mantle.
"Superplumes refer to these two features at the bottom of the mantle,
not the hot spot surface expression of narrow plumes," says Barbara Romanowicz
of the University of California at Berkeley. "Seismologists don't know
yet if these superplumes are large features from one plume or a collection
of much more narrow plumes in the sense that geodynamicists think of them."
In this week's issue of Science, Romanowicz suggests that the
continuation of the superplumes through the mantle may require reevaluating
Earth's heat budget from the core and the role upwelling from the mantle
plays in the driving forces of plate tectonics.
 In these broad regions
of extra hot magma, seismic waves traveling through the mantle slow down.
While previous studies indicated these superplumes traveled high above
the core-mantle boundary, "other models of the upper mantle don't show
as clearly the relationships between these two superplumes in the lower
and upper mantle," Romanowicz says.
In these broad regions
of extra hot magma, seismic waves traveling through the mantle slow down.
While previous studies indicated these superplumes traveled high above
the core-mantle boundary, "other models of the upper mantle don't show
as clearly the relationships between these two superplumes in the lower
and upper mantle," Romanowicz says.
Rather than using the changing velocity of seismic waves to determine
the temperature patterns of the upper mantle, Romanowicz and graduate student
Yuancheng Gung studied the amplitudes of these waves. "Seismic waves travel
faster through cold and rigid slabs, but travel time or velocity
is sensitive to chemical composition and in the upper mantle the effects
are competing," Romanowicz says. "Temperature distribution blurs travel
time signals making it more difficult to interpret."
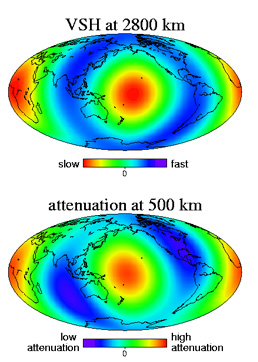
At left, the top map shows
seismic velocity in the lower mantle, while the bottom map shows the attenution
of seismic waves (a decrease in amplitude or energy) in the upper mantle.
High attenuation occurs in areas of high temperature. Image courtesy of
Romanowicz and Gung.
They produced 3-D maps that showed decreasing amplitudes of the waves,
or their attenuation through hotter-than-average material in the upper
mantle. "We're using attenuation measurements that are more sensitive to
temperature. It measures how seismic waves lose energy as they propagate
through hot, soft absorbing material," Romanowicz explains.
Linking their maps to previous velocity maps of the lower mantle created
a close match. "They show the hotter bits in the lower mantle are beneath
the hotter bits in the upper mantle. One is above the other," says geologist
Kevin Burke of the University of Houston in Texas. But at some points the
flow has shifted in the upper mantle, indicating a change in direction
of the upwelling flow. "This is an innovative, comprehensive review on
the way in which heat moves in the mantle driving forces for plate tectonics,"
he says.
But the role these hot areas play in perpetuating the cycle of plate
tectonics is itself a contentious sticking point for modelers. "Geodynamicists
say the most important feature in mantle driving convection pattern is
the cold slabs falling into the mantle and displacing material," Romanowicz
says. "They consider the return flow that rises a passive return flow.
We think because these features are strong and continue through the mantle
that they must be putting energy into the system. Some heat from the core
is basically driving the upwellings."
Gerald Schubert of the University of California in Los Angeles is skeptical
of Romanowicz's findings, calling the comparison between the attenuation
of the upper mantle and the velocity of the lower mantle a tenuous connection.
Because seismic velocity measurements come with differing interpretations,
a better comparison would be "attenuation throughout the mantle and show
the connection between the upper and lower mantle this way," he says. "Then
you could significantly say when you measure attenuation you have a stronger
case to interpret measurement in terms of temperature."
Christina Reed
