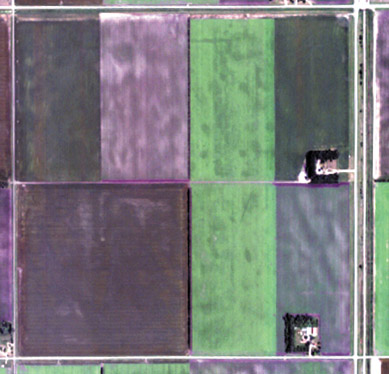
[Right: This image from the Space Imagings Ikonos satellite shows Pete Carsons farm in July 2000. The green fields are sugar beets. Image credit: Space Imaging]

Fertilizer application is a modern work of art. Gone are the days of uniformly dumping 150 pounds of nitrogen per acre as though a fresh field was a blank canvas in need of a base coat. Todays farmers, keen on current technology, use varying amounts of fertilizer depending on where it is needed most. Thanks to satellite images, they can see their farms in shades of green and yellow and work to balance out their harvest.
While farmers do not want any part of their field to be short of fertilizing
nutrients, application is a costly procedure and overapplying can increase
the amount of nitrogen runoff to nearby watersheds, creating hypoxic conditions
harmful to wildlife. In some cases, too much nitrogen can ruin a crop.
[Right: This image from the Space Imagings
Ikonos satellite shows Pete Carsons farm in July 2000. The green fields
are sugar beets. Image credit: Space Imaging]
Ive always been able to grow a high tonnage of sugar beets in our area, but have had to struggle with sugar content, says Pete Carson of the Red River Valley in St. Thomas, N.D., who began searching for a solution to his nitrogen problems in 1978. If you have an abundance of nitrogen, the sugar beets will keep growing their tops and root size; once they hit maturity they will start producing sugar but they wont be very efficient at it.
In the spring of 1999, Carson came across researchers from the Upper Midwest Aerospace Consortium (UMAC) who were working in conjunction with his local co-op and neighboring state universities to ground-truth satellite images with matching coordinates and roads. Carson was one of 15 farmers in St. Thomas from the almost 50 UMAC worked with to use their farms as testing sites. Carson and another farmer from across the Red River Valley, Gary Wagner of Minnesota, have since become advocates of remote sensing technology.
On the flip side, the UMAC researchers found significant benefits to working with farmers and ranchers as partners instead of clients and experimenting on their fields instead of on small plots. The researchers presented their report on applications of remote sensing to precision agriculture at a meeting of the American Geophysical Union in Boston on May 30.
Precision farming is recognizing that there are differences in a field and applying the right quantities at the right place at the right time, says Santhosh Seelan of UMAC. The trend toward precision agriculture began a number of years ago with the use of the Global Positioning System (GPS) and Geographic Information Systems (GIS). Farmers could program equipment to apply different amounts of fertilizer depending on where the machines were in the field.
But to determine where variations in nitrogen occurred, the farmers needed to take an extensive number of soil samples. This was pricey: sampling in a grid pattern on a quarter section of land, 160 acres, could cost $2,200 or more. Carson owns a farm thats considered small at 1,500 acres.
Remote sensing can eliminate the need for grid sampling by identifying the variations in a field based on the plants ability to absorb different wavelengths.
Previously, the idea was farmers would flock to the impacts satellites could have on agriculture. But we found it has taken the successes of early adopters to draw in the interest of other farmers, says George Seielstad of the University of North Dakota and primary author of the report. Remote sensing isnt the panacea. It didnt replace everything they had. It added to the information.
Measuring in near-infrared and red bandwidths, the satellite images show where plants are absorbing more red light, and hence producing more green chlorophyll. Plants that stand straighter and taller with more leafy coverage also absorb more light than plants that are low to the ground. The farmers need to only check a few areas to determine what exactly is happening at a specific location and then correlate that with the same remote sensing signals for other areas.
The satellite imagery helps break the field down into management zones of irregular shapes and irregular sizes, Carson says. The cost of zone sampling 160 acres can drop the price to about $400, he says. The soil samples then show how much fertilizer may be needed in each zone. But the satellite image of the previous crop can indicate that some of the areas within a zone may already have residual nitrogen.
Using the information from the satellite images in conjunction with field mapping and other precision agriculture techniques, Carson reduced his nitrogen use by 35 to 45 percent, he says. For Gary Wagner, that same reduction in nitrogen led to a saving of $51,000 over a four-year period and an average 123 tons less nitrogen fertilizer per year into the environment.
My experience sharing this information with other farmers is that during the PowerPoint presentation when that first satellite image comes up and I see a blank look glaze over the audience I know Im in trouble, Carson says. But its becoming more accepted all the time.
Christina Reed
 |
Geotimes Home | AGI Home | Information Services | Geoscience Education | Public Policy | Programs | Publications | Careers |