Geotimes

Geoscience Education & Outreach

Using Real-time Data for Public Outreach and Safety
Kyle Blasch

An innovative outreach collaboration began with, of all things, wet feet. The Sabino Canyon Recreation Area, located within the Coronado National Forest, Ariz., includes a popular hiking trail that follows Sabino Creek for about 3.8 miles — garnering more than 1.4 million visitors every year. Nine bridges span the creek along this trail and are prone to frequent overflow during the rainy seasons. Consequently, the visitors center at Sabino Canyon receives a large volume of telephone calls from people asking: “How much water is flowing in Sabino Creek?” and “Are the bridges safe to cross?”
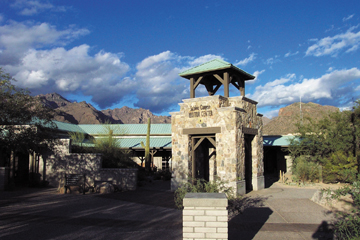
While the U.S. Geological Survey (USGS) has been collecting stream flow data in Sabino Canyon for almost a century for use in flood forecasting and warning networks, the data have been largely inaccessible by the public. Only a person visiting the bridge daily could answer the day-to-day streamflow questions. Because the visitors center and the bridges are several miles apart, interpreters typically relied on returning hikers to report on creek conditions but could never be truly certain of the information provided.

The solution to this dilemma was in the use of real-time data. USGS operates a nationwide, real-time network of streamflow gaging stations that includes a station on Sabino Creek. Data are collected every 15 minutes and transmitted every four hours by satellite to a receiver at the USGS office in Tucson. Real-time streamflow data immediately upload to the USGS Web page.

A touch-screen kiosk appropriate for visitors of many ages, nationalities and disabilities displays real-time earth science data. Photo provided by Kyle Blasch.

Inspired by the real-time streamflow data, a multi-agency team created a series of interpretive exhibits. These exhibits take advantage of additional real-time climate and hydrologic data collected by USGS, the U.S. Department of Agriculture’s Forest Service (Coronado National Forest) and the National Science Foundation Science and Technology Center for Sustainability of semi-Arid Hydrology and Riparian Areas (SAHRA). The exhibits extract the real-time data from the Internet and display them in a format that is understandable and informative to the visitors. Now visitors to Sabino Canyon have only to consult the data display to see current streamflow conditions and to determine if the bridges are safe to cross. Alternatively, before potential visitors hit the trails, they can log on to the Internet to view the real-time information from their homes.

Within the recreation area, a combination of sensors and transmission methods yield the diverse climatic and hydrologic real-time data. Each participating agency makes its data available on its Web site so that the data can become part of the interpretive displays. For example, SAHRA operates a 30-meter meteorological tower near the headwaters of Sabino Creek, overlooking the Tucson Basin. A Web-controlled streaming-image camera installed at the top of the tower provides an image of the current weather conditions to coincide with the real-time meteorological data incorporated into the displays.

The 
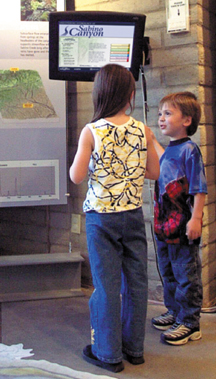
potential use and public awareness of these data have broadened tremendously. Since the exhibits were installed in October 2002, visitors have been accessing the exhibits almost nonstop during busy days. Peaks in Web site usage have coincided with rainfall events.

Earth science data collected within the Sabino Canoyon Recreation Area are displayed in a series of exhibits at the Sabino Canyon Visitors Center. Photo provided by Kyle Blasch.

The Sabino Canyon exhibits are just one example of how real-time data can immediately provide information for interpretation and outreach. Real-time data and images incorporated into Sabino Canyon’s displays are also used to verify and communicate flash-flood safety warnings, fire-danger warnings and current weather conditions. In addition, the information teaches visitors valuable lessons on climate variability by enabling them to compare observations at the visitors center with the historical record and current conditions in different parts of the recreation area. For example, a visitor at the base of the canyon who may be experiencing the dry heat of the Sonoran Desert can view images of snowfall 7,000 feet higher at the headwaters of the creek, or follow the progress of a flash flood as it surges down the canyon after a recent monsoon thunderstorm. If that doesn’t satisfy a visitor’s curiosity, the exhibit provides statistics such as the high and low air temperatures for the day, daily streamflow values for the last year, cumulative snowpack, and the total amount of precipitation for the year at different elevations.

Real-time data are a marvelous resource that can increase the value of data collection if incorporated into everyday applications and at locations popular with the public. Within Arizona, USGS and SAHRA are working with several State and National Park Service units to design interpretive exhibits that incorporate real-time Earth science data. Such opportunities are an important way individual geoscientists can participate in and affect their local communities.


Blasch is a hydrologist with the USGS and a volunteer resource interpreter at the Coronado National Forest in Tucson. Please contact him for more information on planning local real-time data exhibits: kblasch@usgs.gov.

Back to top

Geotimes Home | AGI Home | Information Services | Geoscience Education | Public Policy | Programs | Publications | Careers

© 2024 American Geological Institute. All rights reserved. Any copying, redistribution or retransmission of any of the contents of this service without the express written consent of the American Geological Institute is expressly prohibited. For all electronic copyright requests, visit: http://www.copyright.com/ccc/do/showConfigurator?WT.mc_id=PubLink