

 |
|
|
Hailstones thrown at climate
models
Preparing for earthquakes
An eye on Braille
Oldest dinosaurs may reveal
evolutionary secrets
Politics rule the evolution
debate in Kansas
Long-time melting
Leaking Earth
Moon keeps its water secrets
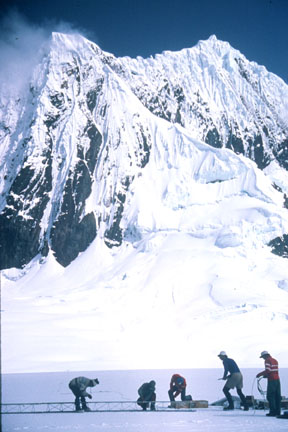
In preparation for drilling ice cores, a research team
in
|
Close to a hundred scientists
from around the country met during a crisp, clear week in October to piece
together their knowledge of water vapor in the climate system. And as sunlight
broke through stained-glass windows in the Potomac, Md., auditorium, a
few scientists took the opportunity to hurl, or gently lob, hailstones
at the science behind climate modeling.
In contrast to the first Chapman Conference on water vapor five years ago in Georgia, where reverence for modeling dominated, there was a healthier amount of skepticism this time, says Kerry Emanuel of the Massachusetts Institute of Technology. People were more willing to talk about the problems. Modeling the climate system may have always been a contentious issue, but only recently have debates over the accuracy of the models intensified. And as demonstrated in discussions during the American Geophysical Unions second Chapman Conference Oct. 1215, water vapor, the uncondensed version of a cloud, plays a significant role. Parts of the models that we thought were accurate and did not present
an issue turn out to have major discrepancies, says Albert Arking of Johns
Hopkins University. Most current radiative models and whole-earth system
models tend to calculate an atmospheric absorption of 17 to 20 percent
of solar radiation, whereas observations put that percentage at 25, he
says. It depends on where clouds are, but on the average it doesnt mattereven
with clear skies the discrepancy persists.
|
Regardless of the source of error, a discrepancy may indicate the models overestimate the vigor of the hydrological cycle, giving evaporation and precipitation stronger roles than perhaps they deserve. The impact of such a difference is likely to affect how the models interpret feedback mechanisms in calculations of global warming.
And a discussion on feedbacks opens up an entirely different debate involving water vapor. Richard Lindzen of the Massachusetts Institute of Technology argues the climate models are not correctly determining the distribution and physical processes involved in transferring water vapor to the upper troposphere. The models, he says, add positive feedbacks to the system that in reality may not exist.
We have no right to be confident that these feedbacks are correct, colleague Emanuel says. Double carbon dioxide and keep water vapor constant and the models predict a warming of only 1.01.2 degrees. However, add in the feedbacks that amplify the effects, such as water vapor, and the models predict that global warming may increase by as much as five degrees. Such an elevated change may not necessarily be real, they argue.
Water vapor, the most abundant gas in the atmosphere, and also considered the most important, may also be the most controversial. We have not a clue how it functions, Lindzen says. There are assumptions that water vapor is carried by motion, such as wind, from place to place, he says. But little is known about the physics that supply the moisture to the atmosphere.
Although some scientists contend that Lindzen may be right about the inadequate knowledge of the physics of water vapor, they still support the models predictions. There are a lot of unknowns in our understanding of water vapor in Earths atmosphere, says Lonnie Thompson of the Byrd Polar Research Center in Columbus, Ohio. But it is certainly in line with what the models predict and what we are seeing in nature. Thompson presented evidence at the October conference that tropical ice fields are disappearing. The ice cores he studies offer a history of precipitation, a proxy for atmospheric water vapor.
Emanuel explains that models are not numerically configured to handle water vapor correctly. And this lack of numerical resolution may be masking the problem of inaccurate physics. Water vapor is controlled by cloud microphysical processes, he says. But the microphysical processes are not predicted by the models. Water vapor decreases with height exponentially every three kilometers, requiring vertical grid spacing of 300 meters in order to obtain a high resolution. Although weather forecasting is close to that, he says, climate models, which need longer time scales, are nowhere near this vertical resolution.
With the focus on errors, the debates over how well the models work are shifting. For Lindzen, so far the change is incremental. In the next five years, Im optimistic that we will see a far more convincing picture, he says. We need to get beyond the do-you-believe, dont-you-believe models, and establish a concrete idea of how feedbacks work to fix the models. It is crucial to take it out of religion.
Christina Reed
Geotimes
The San Francisco Bay area has a 70
percent chance of being hit by a 6.7 or larger magnitude earthquake before
2030, the U.S. Geological Survey reported on Oct. 14. Two days later, a
7.0-magnitude earthquake shook the Mojave Desert.
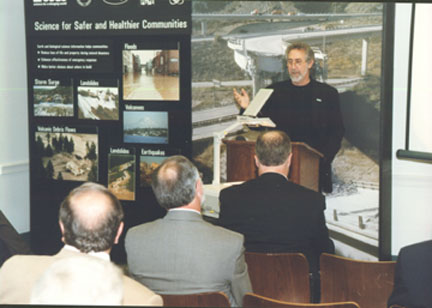
David Schwartz of the U.S. Geological Survey during and Oct. 22 briefing at the U.S. Capitol discusses lessons learned from the 1989 Loma Prieta earthquake. U.S. Geological Survey |
As a result of heavy urbanization in the Bay area, future earthquakes have the potential to cause much more damage than the 1989 Loma Prieta earthquake, says David Schwartz, chairman of the working group that prepared the report. Ten years ago the Loma Prieta earthquake was captured on camera as Americans watched the third game of the World Series in San Francisco. Though centered more than 50 miles south of the city, the 6.9-magnitude earthquake killed 69 people and caused over $6 billion in damages. The anniversary of the World Series earthquake coincides with a renewed interest from Congress in earthquake mitigation. |
Rep. Nick Smith (R-Mich.) held a hearing in Washington Oct. 20 to explore the current status of U.S. earthquake research programs and how information gathered from these programs is shared with communities. On Oct. 22, the American Geological Institute and the U.S. Geological Survey hosted a briefing in the U.S. Capitol entitled, Ten Years After the World Series Earthquake: Progress Toward Safer Communities. It was the first in a series sponsored by Rep. Tom Davis (R-Va.) to investigate ways to use scientific information for building safer communities.
An earthquake of similar strength [to the Mojave Desert quake] occurring in a heavily populated area in the U.S. would result in catastrophic loss of life, said Schwartz, the opening speaker of the Oct. 22 briefing. It is my hope that the lessons we learn studying earthquakes abroad will help us to be more prepared when it happens here.
In Taiwan for example, more than 1,000 digital seismic recording instruments network the island. These instruments provide information to rescue workers about which areas suffered the worst damage. Although California is twelve times the size of Taiwan, it hosts only 1,400 of these strong-motion stations.
Witnesses at the House subcommittee hearing discussed the collaborative Trinet project in Southern Californiaa system that deals with real-time alert systems, similar to those in Taiwan. Within minutes of the Mojave Desert quake, the Trinet project produced a map of ground shaking. The next step in these programs, Schwartz says, is transferring information such as shake maps and hazard maps to the local level to help mitigate the effects of future earthquakes.
And California isnt the only part of the United States that needs such a seismic network and alert system, says USGS scientist Mary Lou Zoback. This is one perception problem we need to get beyond, is that its just a California problem, she says. As an example, she cites ongoing research showing that earthquake hazard should be closely monitored around the Wasatch Fault in Utah.
Zoback and other earthquake researchers discussed earthquake hazard
during the October annual meeting of the Geological Society of America
as part of a press conference on this years Turkish and Taiwan quakes
and Octobers California quake.
Margaret Baker
AGI Government Affairs Program
Kristina Bartlett, Geotimes, also contributed to this report
So what happened, and why was NASA surprisingly pleased? Trouble arose when the Deep Space 1 onboard navigational system lost its bearings thousands of miles from Earth. But of more importance to NASA, the propulsion system that carried the spacecraft those thousands of miles worked like a charm.
On July 28, 1999, Deep Space 1 sailed toward asteroid 9969 Braille at 15 kilometers per second, thrust forward by its new ion propulsion engine. The engine, a mere 12 inches in diameter, converts xenon atoms into positively charged ions and expels them at a speed of approximately 68,000 miles per hour. And unlike conventional engines, ion propulsion can use anything for its fuel, including safe, inert gases ideal for manned missions. The technology is much more efficient than comparable engines, and it may eventually allow NASA to design missions that reach beyond the solar system.
| While ion propulsion and most of the 12 other new technologies onboard
were successfully tested, something clearly went wrong 23 minutes before
the spacecrafts closest approach to Braille. At that time, the Deep Space
1 auto-navigation system, known as AutoNav, panicked and sent the probe
off course.
AutoNav is designed to head toward a given point in space, using periodic snapshots of its surroundings for guidance. But, when Deep Space 1 was within range of its target, the snapshots revealed only empty space. The Active Pixel Sensor, a new imaging device onboard the spacecraft, could not see Braille. Housed on a single electronic chip, the sensor was slated to be a replacement for charged couple device (CCD) technology onboard other NASA craft. The CCD, akin to the technology found in a digital camera, is heavier than the Active Pixel Sensor and doesnt provide the same detailed data |
An artist's conception of Deep Space 1 with its ion propulsion system. NASA/JPL/CALTECH |
Although Deep Space 1 approached its intended target of 10 kilometers from Braille, the altered flight path caused the imaging systems to face the wrong direction. Deep Space 1 was 15,000 kilometers away before it captured its images.
The data, including the first infrared spectrum of Braille, revealed olivines and pyroxenes of ordinary chondrite compositions on the asteroids surface. The new information supports the mineral compositions suggested by ground-based observations made by Richard Binzel of the Massachusetts Institute of Technology, and others. And the timing couldnt have been better. The next good opportunity for Earth-based observations of Braille does not occur until 2010, Binzel says.
The small dataset, while important, might seem a disappointment to NASA scientists and engineers. However, Deep Space 1 is actually not a science mission, Britt says. Its a technology demonstration mission. What [were] trying to do is demonstrate ion propulsion. The new technologies are key to NASAs goals for the 21st century of building lighter, faster and cheaper probes.
Deep Space 1 will have its next opportunity to prove its skills on Jan. 15, 2001, when it encounters the asteroid 4015 Wilson-Harrington. An Apollo category Near-Earth Object, an object with an orbit that crosses Earths orbit, Wilson-Harrington is considered an important second chance for Deep Space 1. It was first discovered as a comet, with one image revealing a plume of material emanating from its body. The plume could have been either debris from a recent impact on the asteroid surface or an outburst of gas. Deep Space 1s data will help scientists determine whether Wilson-Harrington is in fact a comet or an asteroid, and will provide new data from an unusually fresh surface.
The final target for the spacecraft is the comet 19P/Borrelly. Once the xenon fuel in Deep Space 1 is burned it would be nice to be near something, Britt says. When researchers planned the Deep Space 1 mission, they selected the final encounter with Borrellybased on launch time parameters, launch energy and projected changes in spacecraft velocityand then worked backwards to find the other objects on the way. It was a comet in the right place at the right time, Britt says.
The NASA scientists will use the lessons from the Braille encounter
to guide future flybys. And they are learning from their mistakes. I think
people have to realize that this is a new kind of NASA mission, Britt
says. Trying new things may not work, but thats okay, he adds. You learn
from that, you go back, you do it better the next time. And with Deep
Space 1, were lucky enough to have a couple next times, he says.
Josh Chamot
Geotimes contributing writer
We lucked into not only finding something, but [found] spectacular
fossils from a very interesting time period, says Andre Wyss, an associate
professor of geology at the University of California, Santa Barbara, and
co-leader of the research. They unearthed fossils belonging to two different
prosauropods, herbivores with long necks and small heads, representing
the earliest dinosaurs, and biostratigraphically constrained them to the
middle to late Triassic (225 to 230 million years ago).
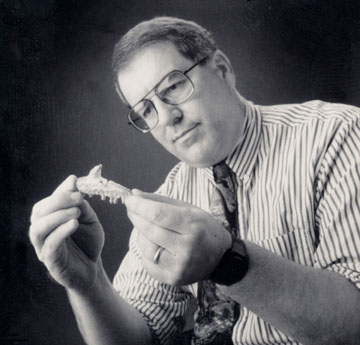
John Flynn, MacArthur Curator and Chair of the Department of Geology at Chicago's Field Museum of Natural History holds the remains of what may be one of the world's oldest dinosaurs. The fossilized jawbone is from one of two new plant-eating prosauropods discovered by a team of paleontologists Flynn was working with in Madagascar. The fossils are on exhibit at The Field Museum until Jan. 2, 2000. Photo courtesy of theField Museum. |
The fossils, including five pre-mammalian animals, may also indicate
how cold-blooded reptiles having mammal-like characteristics evolved into
warm-blooded mammals.
Scientists lack a total understanding of the transition between the early Triassic, characterized by reptiles and amphibians, to the dinosaur-dominated late Triassic, because the fossil record between these times is sparse. But this middle to late Triassic fossil assemblage, described in the Oct. 22 Science, helps clarify the geologic record. It is important because there isnt another assemblage like it anywhere in the world, Wyss says. Its our best, if not only, record of this pivotal interval in the history of backboned animals. The prosauropods, identified by their jawbones, will have specific names
after paleontologists remove and study the other fossils in the surrounding
sediment. The discovery points to a rich new archive of information about
lifes past, an archive weve only begun to tap.
Julia Cole
|
This is not a battle of science and religion and never was, Gould said in an Oct. 7 question-and-answer session with Kansas University faculty, staff and students. Gould did acknowledge that opponents of evolution had been successful in depicting the issue as one of fairness. Evolutions opponents in the state have argued for equal classroom time for the teaching of alternatives to evolution. Failing that, they have argued that teaching about large-scale evolutionary changes should be optional.
They have in their heads the model of equal time, which is a good model for political debate, but a terrible model in science, Gould said. The fairness argument may have carried the day with much of the public, though for a different reason. Im not that worried about polls that say that half of all Americans dont believe in evolution all that reflects is how poorly educated Americans are when it comes to science.
Goulds visit to Kansas followed a September visit by Eugenie C. Scott, executive director of the National Center for Science Education. Scott also spoke during an Oct. 27 forum at the annual meeting of the Geological Society of America called Creationism vs. Evolution in the Classroom: Should Geoscientists Take a Stand? One of five panelists at the forum, she encouraged an audience of several hundred geoscientists to avoid the battle between science and religion. Its a non-battle, Scott says. Don Wise of Franklin & Marshall College, another panelist at the forum, encouraged geoscientists to stick to what we have proven: time and the record.
Much of the language used in the Kansas standards came from documents by the National Research Council, American Association for the Advancement of Science and the National Science Teachers Association. All three organizations recently decided to revoke copyright permission for the Kansas board to use such language in their national standards (see Copyright denied to Kansas, Geotimes, November 1999).
Gould offered two ideas that evolutions proponents might stress in
working with people who disagree with or are undecided about the theory
of evolution. Try to convince evolutions opponents, he suggested, that
they have a very skewed sense of the methodology of science, that they
dont understand why the phrase only a theory doesnt make sense. Also
help them understand theres a confluence of agreement about evolution
from a variety of sources.
Debating creationists, on the other hand, is probably not a good strategy,
Gould said. These things are not decided by debate. Thats not how scientific
issues are resolved.
The solution, like the problem itself, is ultimately political.
I assume youre going to vote out the school board at the next election,
Gould told his Kansas audience, referring to the seats that will open on
the school board next year. I expect the Kansas decision to be overturned.
Rex Buchanan
Kansas Geological Survey
Kristina Bartlett, Geotimes, also contributed to this report
Continued regression and perhaps even complete disintegration of the West Antarctic Ice Sheet within the current interglacial period may well be inevitable, lead author Howard Conway of the University of Washington says in the report.
Conway and colleagues discovered the ice sheet has decreased by 1,300 kilometers in the last 10,000 years. It is currently 932,000 square kilometers in size (the area of Texas and Colorado combined), and located in the region of Antarctica closest to the tip of South America.
To determine the ice sheets past melting rates and size, the team used several methods, including radar imaging to observe subsurface ice structures and ground level ice. Carbon 14 dating of diatoms and of penguin guano from Cape Hickey and Terra Nova Bay provided knowledge about freshwater access. When glacier ice melts, penguins and diatoms move in to the open water, leaving a signature for dating the movement of the glacier away from that area. Mollusk shells provide similar information. The oldest shell found in a marine core from the western Ross Sea Embayment north of Ross Island dates close to 7,500 years ago.
Conways team found that the sheets grounding line (the boundary between floating ice and ice thick enough to reach the sea floor) has receded at a rate of about 133 meters a year for 7,600 years. Annually, the sheets melting adds 1 millimeter to sea level worldwide.
The researchers estimate a complete meltdown of the ice sheet would raise global sea levels 5 to 6 meters, flooding low-lying coastal communities worldwide. But if melting continues at its current rate, the ice sheet will last at least another 7,000 years, they say.
Livia Levis
Geotimes contributing writer
Maruyama has used experimentally determined stabilities of minerals for mid-ocean ridge basalts and mantle rocks and calculated pressure-temperature regimes along subduction zones together with plume tectonics to come up with a provocative idea, says geologist Juhn G. Liou of Stanford University. It is very innovative, and certainly mindboggling if even partially true, says Gary Ernst, also of Stanford University.
| The claim that Earth is leaking questions the long-held idea that Earth
has been losing water from the interior throughout its history. Indeed,
there is strong evidence that Earths atmosphere and hydrosphere have
been formed through the degassing from the interior, says Shun-ichiro
Karato of the University of Minnesota. ( see Mantle Gases and Atmospheric
Mysteries, Geotimes, November 1999) So at least in the very early stage
there must have been a period in which water content in the interior of
Earth decreased with time.
But 750 million years ago this trend reversed, Maruyama says. And the return flow of seawater into the mantle began. Measuring the temperature distribution in subducted oceanic lithosphere, the researchers in Tokyo determined that 1.12 billion tons of water flow into the mantle while only 0.23 billion tons is transported back by magma to the surface. The calculation was based on the stability of water-bearing minerals that depend on both pressure and temperature. If a subducting slab is older than 50 million years, then the pressure-temperature path of the surface of the slab passes a critical point of 600 degrees Celsius at 100 kilometers depth. This point divides the fate of water, Maruyama says. Oceanic crust is hydrated prior to its subduction in the active margin, but under hot conditions hydrous minerals become unstable and a recently formed slab at shallow depths will lose a majority of its water. Prior to subduction however, some water is trapped in |
 Earth's water may be leaking back into the mantle and could possibly leave
the planet bone dry in a billion years.
Earth's water may be leaking back into the mantle and could possibly leave
the planet bone dry in a billion years.
Illustration: Shigenori Maruyama, Tokyo Institute of Technology |
If such a reversal occurred in the past, then evidence that the oceans have been sinking should exist. Indication of this happening is found by the fact that most sedimentary rocks on the Earth were formed in the Phanerozoic, Maruyama writes in his abstract, and are rare in the Archean and minor in the Early and Middle Proterozoic. Maruyama argues that sea level, although highly variable, has dropped by 600 meters in the last 750 million years.
But the sea level argument is most problematical, says Dork Sahagian, executive director for the Global Analysis, Interpretation and Modeling of the International Geosphere Biosphere Program. I have never noticed a monotonic decrease in sea level even after accounting for ice and the age of the ocean floor.
It does seem quite plausible to me that, during thermal relaxation, volatiles expelled at earlier, hotter stages might be gradually reincorporated in the cooling planet, Ernst says. But, I see no unambiguous evidence that the Earth has lost 600 meters of ocean water since 750 million years ago. Eventually, as our planet cools, the volatiles will be concentrated dominantly in condensed phases. But are we on our way there yet? I dont know.
If we are, and have been for some time, then Maruyamas observations yield profound implications for the planet even beyond its potential to dry up. The global diversification of surface environment, rapid increase in oxygen, rapid evolution of life and others, all can be explained by my proposal, Maruyama says. But hes no stranger to polemic projects.
Maruyama often has big ideas about how this planet might work and his argument is often based on some petrological and geological observations, Karato says. Other projects Maruyama has begun include decoding whole-Earth history and whole-Earth dynamics for the last five years. My proposal of leaking water is one of my recent works, Maruyama says.
As controversial as his proposal is, if it is even remotely possible that we will go the way of Mars in a billion years or so, Sahagian says, we should want to know about it.
Christina Reed
Geotimes
| On July 31, the NASA Lunar Prospector ended
its 18-month mission to the moon in a spectacular crash at the lunar South
Pole. Telescopes from observatories around the world eyed the moon, watching
for the impact of the 354-pound, barrel-shaped spacecraft to kick up a
vaporous cloud. The probes final descent was orchestrated by scientists
at NASA and the University of Texas, who had planned the crash to answer
once and for all the question piqued by the 1994 Clementine mission and
further given credence by Prospectors indirect observations: Does the
moon harbor water?
Unfortunately, the question remains unanswered. Scientists predicted that the post-crash plume would include ice vaporized by the heat of the impact, but telescopes using ultraviolet-light spectrometers did not detect OH, a water vapor byproduct. The researchers presented their results on Oct. 13 in Padua, Italy, at the annual meeting of the American Astronomical Societys Division for Planetary Sciences. |
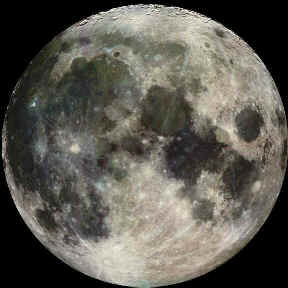
Image taken by Galileo Dec. 7, 1992, on its
way to Jupiter.
|
The lack of definitive evidence does not rule out the possibility of lunar water. Prospector may have landed outside the target area or hit a dry spot at the target site, and the telescopes or analysis may not have picked up optimal data. In addition, instead of existing as ice crystals, water molecules may be bound to surface minerals. If so, the energy of the crash would not have separated the water molecules from the hydrated minerals, and OH would have remained undetected.
It is thought that repeated comet impacts have deposited ice on the
moon, up to an estimated 6.6 billion tons. The planned crash was the final
step of the Prospector mission, which resulted in the first global maps
of the moons elemental composition and gravity; proof of a small, iron-rich
lunar core; and confirmation of the presence of local lunar magnetic fields.
Jennifer Wang
Geotimes contributing writer
 |
Geotimes Home | AGI Home | Information Services | Geoscience Education | Public Policy | Programs | Publications | Careers |