
 Geoscientists
have beefed up a dataset documenting ice cover at Earth’s poles, revealing
a longer and slightly different picture than painted in the past by satellite
observations. The extended view may give hints as to what is driving the differences
between Arctic and Antarctic sea-ice cover.
Geoscientists
have beefed up a dataset documenting ice cover at Earth’s poles, revealing
a longer and slightly different picture than painted in the past by satellite
observations. The extended view may give hints as to what is driving the differences
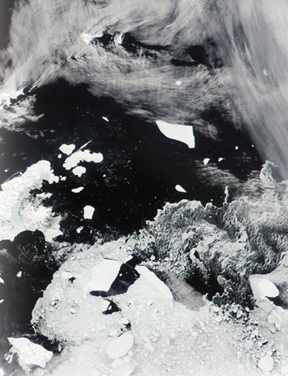
between Arctic and Antarctic sea-ice cover.This true-color MODIS (or Moderate Resolution Imaging Spectroradiometer) image from Nov. 13, 2001, shows several icebergs drifting out of the Weddell Sea. Numerous icebergs are breaking out of the sea ice in the Southern Ocean surrounding the Antarctic Peninsula, as sea ice shows an overall decline in the region. Image by Jacques Descloitres, MODIS Land Rapid Response Team, NASA/GSFC.
Scientists have relied on satellite imagery taken over the past two decades to document the extent of sea ice in the Arctic and Antarctic. Such surveillance had shown that the Arctic has lost ice quickly, about 329,000 square kilometers a decade. At the same time, the Antarctic showed slight gains in ice cover, growing by 112,000 square kilometers per decade. The increase, and opposing behavior, was puzzling.
In order to look further back in time, Don Cavalieri of NASA Goddard Space Flight Center in Greenbelt, Md., and his co-workers spliced together several datasets, from microwave imagers on the Nimbus 5 (1972 to 1977) and Nimbus 7 (1978 to 1987) satellites and the Defense Meteorological Satellite Program (1987 to 2002). The team filled in the one-and-a-half-year gap between the two Nimbus satellites by matching data from the National Ice Center (NIC), maintained by the National Oceanic and Atmospheric Administration and the Navy. The NIC data run from 1972 to 1994 for the Arctic and from 1973 to 1994 for the Antarctic — enough of an overlap to compare with the Nimbus sets, using the aerial images, shipboard data, other satellite data and various sea-ice proxies amassed by NIC.
 By integrating the data,
the researchers stretched the picture of the poles back to 30 years, a minimum
interval for climate change studies, Cavalieri says. They found that overall,
the Antarctic was also losing ice, though not as quickly as the Arctic.
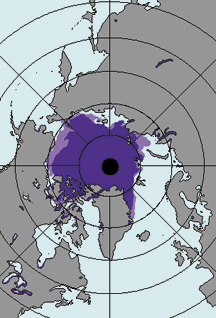
By integrating the data,
the researchers stretched the picture of the poles back to 30 years, a minimum
interval for climate change studies, Cavalieri says. They found that overall,
the Antarctic was also losing ice, though not as quickly as the Arctic.Changes in Arctic ice: Light purple shows sea-ice cover from 1973 to 1976, as compared to the dark purple, 1999 to 2002. Graphic courtesy of Don Cavalieri, NASA GSFC.
During the additional decade of data, the team discovered years when the Antarctic had much more sea ice. Antarctic ice cover had started to increase in the 1960s, but then the sea ice diminished dramatically from 1973 to 1976; it started a slow but steady comeback in 1976, as the satellites watched. That sea-ice plunge in the newly amalgamated dataset changes the Southern Hemisphere picture: Antarctic sea ice has decreased overall, at a rate of 150,000 square kilometers a decade over the full 30-year period.
Writing in the Sept. 30 Geophysical Research Letters, Cavalieri and his co-authors cited an intense cooling after an extreme El Niño-Southern Oscillation (ENSO) event in the Antarctic, which may have contributed to the sea-ice changes in the early 1970s. “There’s some evidence that changes in the atmospheric circulation in the Southern Hemisphere since the mid-1970s may be contributing to the gradual increase in sea ice extent since 1976,” Cavalieri says.
The effects of the Antarctic Oscillation on sea ice aren’t fully understood, however. At the opposite pole, the Arctic Oscillation dominates and has most likely sped up sea-ice loss (in conjunction with the North Atlantic Oscillation and ENSO events), Cavalieri says. The extended 30-year dataset shows that the rate of sea-ice loss in the Arctic increased over the last two decades.
Although the dataset may be “an incremental advance,” says Ted Scambos of the National Snow and Ice Data Center in Boulder, Colo., the 10-year extension confirms what’s been happening in the Arctic. “It’s a long-term trend that’s harder to brush aside as decadal variations in the climate,” he says. “With each passing year, it’s more likely that the decreases represent a shift in climate due to global warming.”
Scambos agrees that the lengthened record also indicates something shifted in the Antarctic. In 1975, scientists noted changes in Antarctic airflow patterns, particularly over the continent’s peninsula, just south of South America, but they have not been able to pinpoint the cause.
In the future, Scambos says he would like to see the researchers break down their dataset to look for regional sea-ice changes in both the Arctic and Antarctic. The southern continent’s land mass probably balances changes in Antarctic sea ice, he suspects, in contrast to the Arctic.
With more data on sea-ice change and other conditions at the poles, Scambos says, future debate can shift to how climate change is going to work. Scientists, he says, will have to determine “whether global warming will introduce new climate patterns, or if old climate patterns will just shift … and occur in increasing frequency.”
Naomi Lubick
Back to top
