
 For the
first time, scientists have been able to quantify the causes of year-to-year
variability in global rainfall. After seasonal variations such as monsoons,
it seems the major culprit is the El Niño-Southern Oscillation (ENSO)
— a phenomenon in which seesawing ocean temperatures and atmospheric pressures
in the equatorial Pacific change weather patterns around the world.
For the
first time, scientists have been able to quantify the causes of year-to-year
variability in global rainfall. After seasonal variations such as monsoons,
it seems the major culprit is the El Niño-Southern Oscillation (ENSO)
— a phenomenon in which seesawing ocean temperatures and atmospheric pressures
in the equatorial Pacific change weather patterns around the world.
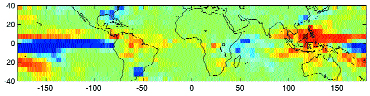
This NASA-created index map condenses five years of data from 1998 to 2003 to
show annual changes in rainfall. Areas in blue receive more rain whenever areas
in red experience a shortfall in rain, and vice versa. The year-to-year change
in rain is smallest in the green areas. The global pattern confirms that El
Niño is the second largest factor, after seasons, in changing how and
where rain falls around the world. Courtesy of TRMM/NASA/JAXA.
"We know rain fluctuates," says Ziad Haddad of the Jet Propulsion
Laboratory (JPL) at Caltech in Pasadena, Calif. The question is: "What
are the reasons behind these fluctuations?"
To find out, Haddad and colleagues at JPL and NASA's Goddard Space Flight Center
in Greenbelt, Md., used satellite data to develop a rain anomaly index —
an indicator of where in the world rainfall was departing most from the normal
local monthly accumulation. The team then compared the index of rainfall fluctuation
with the ENSO indices of sea-surface temperature and atmospheric pressure and
found that wetter- or drier-than-normal weather correlated strongly with the
intensity of ENSO phases, as reported in the Sept. 11 Journal of Geophysical
Research.
"So far, we can assert that the main drivers of the global change in rainfall
are, in order of importance, the seasons and ENSO," Haddad says.
The index is based on the most comprehensive dataset ever compiled of tropical
rainfall measurements over both land and water. Collected between 1998 and 2003,
the data come from microwave and radar instruments aboard the joint NASA and
Japanese Aerospace Exploration Agency's Tropical Rainfall Measuring Mission
(TRMM) satellite.
"For the first time, we were able to get the best possible estimate of
what El Niño does to rainfall around the entire Earth," says Jeffrey
Halverson, a TRMM researcher at NASA Goddard Space Flight Center who was not
affiliated with the study, "and it is a dramatic shift in the location
and intensity of the rainfall."
Using historic rain gauge data, some of which was the legacy of colonial empires
that occupied the tropics, the researchers extended the index back 50 years
and compared it to historic ENSO indices. "The fact that the rain-change
index, which comes directly from global measurements, tracks the ENSO indices
from the 1950s to the present confirms that El Niño is the principal
driver of global year-to-year rainfall change," Haddad says.
Scientists have long recognized a connection between ENSO and precipitation.
For example, during El Niño (the ocean-warming phase), parts of Indonesia
and the Amazon basin suffer droughts, while during La Niña (the cool
phase), they experience excessive rainfall. Likewise, the U.S. Southeast and
California are wetter than normal during El Niño and drier than normal
during La Niña. But until now, the data required to show quantitatively
that ENSO is the driving force behind this variability had been lacking.
Until 1979, global rain data came from rain gauges, which were sparsely placed
throughout the oceans. Since 1980, infrared radar has collected cloud-top temperatures
from space. But these instruments did not function well over land and were not
as accurate as microwave sensing is at measuring actual precipitation over both
land and sea. Thus, before TRMM, researchers did not understand the amount of
rainfall in the tropics "to within a factor of about two," Halverson
says, "and that's a huge amount of error."
TRMM was launched in November 1997, just as one of the strongest El Niños
of the century was beginning. From 400 miles above Earth, TRMM monitors the
tropics and subtropics — the region between 35 degrees North latitude and
35 degrees South latitude, where two-thirds of the planet's rain falls from
hurricanes, monsoons and tropical thunderstorms, mostly over the oceans.
The findings from this TRMM study could be important for tropical countries
that deal with extreme variation in their water supply. "Tropical rainfall
has a tremendous amount of variability from year to year," Halverson says.
"You can have very dry years alternate with extremely wet years and that's
very difficult for societies that are struggling, particularly societies that
rely on agriculture or have limited freshwater access."
However, while the finding that ENSO is the driving force behind variability
applies across most of the tropics, there are regions, such as the Bay of Bengal
and the western Indian Ocean, that exhibit rainfall extremes that do not seem
to correlate strongly with ENSO. "In other words, the areas are affected
by ENSO, but not in such a simple way as to say that they are wetter than normal
during warm phases and drier than normal during cold phases or vice versa,"
Haddad says.
Understanding what factors other than ENSO are affecting rain globally is an
area of continuing research, Haddad says.
Sara Pratt
Geotimes contributing writer
Back to top
 |
Geotimes Home | AGI Home | Information Services | Geoscience Education | Public Policy | Programs | Publications | Careers |