
|
NEWS NOTES | January 1999 |
A layered inner core?
Geo-soldiers
Live from the ocean
Researchers look ahead
Dust trackers
Improving geoscience curricula
Loose cannons
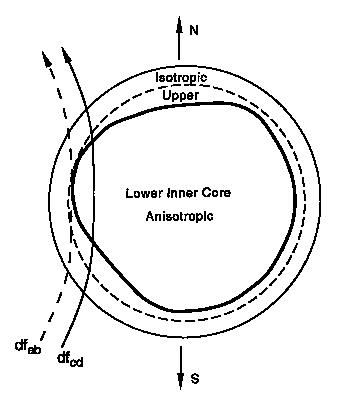
Xiaodong Song of Lamont-Doherty Earth Observatory one of the original researchers to propose that Earths core rotates faster than the planet and Don Helmberger of the Seismological Laboratory at the California Institute of Technology, published their findings in the Oct. 30 issue of Science and presented their work during the December meeting of the American Geophysical Union in San Francisco. They measured the varying arrival times and phase changes of earthquake-generated seismic waves traveling from the South Sandwich Islands in the South Atlantic Ocean and from quakes just west of the islands, to seismic stations in Alaska, Canada, Korea, Russia, and Germany. The researchers believe their conclusions could be important in understanding the source of anisotropy in the inner core the tendency for seismic waves to travel at different velocities in different directions when they pass through the inner core. The anisotropy arises from a crystal alignment of iron in the inner core.
Recent studies have shown that the anisotropy of the inner core in general decreases outward from its center. Song and Helmberger go further and suggest that an upper layer of the inner core is completely isotropic the waves traveling through it have identical properties in all directions. Their analysis of the seismic waves points to a 50-kilometer transition zone between the inner cores isotropic and anisotropic layers.
This study provides direct evidence of a very sharp transition, Song
says. Just as light waves refract when they travel from air to water, so
did the seismic waves refract as they traveled from one layer of the inner
core to another, he adds. More importantly, waves traveling north-south
through the inner core arrived at the seismic stations with more variations
than did waves traveling east-west through the core. Thats because the
inner cores anisotropy is aligned in the north-south direction, Song explains.
The change from an isotropic inner-core region to an anisotropic region
would be sharper and easier to record for waves traveling north to south.
These observed phase and velocity differences could only arise from
a discontinuity within the inner core, Song and Helmberger contend. More
specifically, the different arrival times are evidence of a triplication
a branching of one wave into three different waves of the earthquake
waves as they traveled from the South Sandwich Islands and hit the proposed
transition zone. Each wave would have branched into three different waves
with three different arrivals at the seismic stations. The simplest explanation
to the observed phenomenon [arrival differences] is a triplication produced
by a sudden increase in velocity along [north-south] paths due to a change
in the inner core anisotropy, they write in Science.
Most compelling, they observe, were the changes in waves traveling from earthquakes occurring just west of the South Sandwich Islands to the German Regional Seismic Network. These waves actually reflected from a point Song and Helmberger say was about 95 kilometers below the top of the inner core. This reflection supplies direct evidence for a discontinuity within the inner core, they write. We actually saw reflected waves. If you have this kind of boundary you will see reflected waves a very sharp change in the wave direction instead of small changes in wave direction, says Song.
Wrestling with gravity?
Song and Helmberger havent pinpointed the exact location of the transition
zone. In fact, they say, it probably varies with depth. At some points
it could be 100 kilometers from the top of the inner core, at other points
300 kilometers. The transition zone probably varies laterally, they say.
Perhaps, Helmberger says, this isotropic layer of the inner core is perturbed by convection. The lower, anisotropic layer is not stirred by convection, so its crystals line up. A gravitational coupling between the mantle and core could churn the upper isotropic layer; the layer could also be affected by Earths magnetic field. Thus, Helmberger speculates, the varying thickness over time of this isotropic layer could coincide with changes in Earths magnetic field. If that layer is changing over time, then the magnetic field would know about it and vice versa, he says.
To observe these changes, Song and Helmberger say theyll need more seismic arrays. Better imaging of the inner core structure will help us distinguish different mechanisms of anisotropy as well as help us constrain the inner core rotation better, says Song.
Researchers studying the inner Earth are still debating the dominant
crystal structure of the inner core: is the iron arranged as a face-centered
cubic, hexagonal close-packed, or recently discovered b
structure? Maybe in the inner core there are different phases of iron,
Song says. We dont know. The main thing, he adds, is that the researchers
observed changing wave behaviors for different depths within the inner
core. Whether those changes point to phase changes or different crystal
alignments within the inner core remains to be determined. Why this is
such a sharp change is really unclear yet, Song says. Its all related
to where the anisotropy comes from in the first place ... it may all be
related to how the inner core is formed.
K.B.
During a session of the Geological Society of America meeting in October (Military Applications of Engineering Geology), scientists from the United States and the United Kingdom described a variety of geoscience applications now being used by the military. Whether for identifying fracture zones to locate and blow up underground storage facilities or for evaluating terrain to build roads, geology has become a necessary part of military operations.
David Patrick and Suzanne Boyd of the University of Southern Mississippi described how the Army National Guard incorporates geology and other sciences into its training program at Camp Shelby Training Site (Geologic Data in Military Training) in order to comply with environmental regulations and cultural considerations.
Military training compounds are huge tracts of land that provide the space needed for recruits to practice maneuvers and fire weapons, explained Patrick. Camp Shelby is a 134,000-acre site that encompasses hardwood and pine forests as well as wetlands and is home to endangered species such as the gopher tortoise. Its against the law to kill or endanger the tortoise, says Patrick, and forbidden for tanks to maneuver in the 15,000 acres of wetlands some of which are easy to spot and some of which are not. These are honest-to-goodness wetlands but some have standing water at the surface and others dont, says Patrick.
Wetlands, streams, and slopes are all off-limits, so tanks must stay on hilltops. Trees are painted blue to show the boundaries and keep the tanks in place. But the tanks have to be able to travel and maneuver, so legal wetlands crossings, corridors of gravel, and sandbars have been brought up to grade. The Guard also needed a plain-language classification of the wetlands to make it easier to differentiate between the various areas. This was accomplished and a geologic map constructed as well, showing the critical habitats and wetlands and the important geologic controls of the area: lithostratigraphy, weathering and soils, hydrology, and geomorphology.
On the offensive
Around the world, militaries have storage areas hidden underground
for aircraft, ammunition, submarines even troops. Thomas Eastler of the
University of Maine and Robert Jacobi of the State University of New York
at Buffalo described how to locate and take out enemy targets.
Since weapons can be safely stored underground, explained Eastler, we need to find a way to neutralize them. The trick, of course, is finding them first. Vegetation or sand often cover the bedrock that conceals a storage area. Eastler and Jacobi look for fracture systems (disturbed bedrock is the first clue) to locate weapons storage units and destroy them. We must know the third dimension we must be able to rubble-ize the cover and target, Eastler says. Understanding the characteristics of the fracture system is important for determining the trajectory of the missile that will be used in the strike.
Remote-sensing data can be used to recognize these Fracture Intensification Domains or FIDs, said Jacobi. By integrating lineament analyses of Landsat and hyperspectral images, air photos, and topographic maps with advanced analysis techniques of fractures observed in outcrops or boreholes, he and his colleagues are trying to model fractures in the denied (inaccessible or enemy) areas. The greater the density of the fractures, the more the integrity of the bedrock is impaired implying a disruption to the bedrock and a possible military site.
War and peace
Scientists and military leaders in England are using geology to assist
in peacekeeping efforts. Paul Nathanail, University of Nottingham, discussed
different peacekeeping strategies and how they have changed over the years.
There are three levels of peacekeeping involvement, he explained. The United
Nations may have to step in to keep the two sides apart, where two belligerents
are not playing ball. Or two antagonistic parties may allow a third party
to serve as an intermediary. Wider peacekeeping tactics are called for
in some highly volatile situations when a much stronger effort, and perhaps
humanitarian relief, are required. Peacekeeping has expanded, Nathanail
added. There are more conflicts now in the 1990s than in the 70s and
80s.
And a multinational force is a reality. At the same time, he added,
we have reduced armed forces [because of] the end of the cold war. The
new post-conflict priority has become de-mining operations.
Nathanail said that the British military uses geology extensively. Missions rely on proper protection, site selection, and mobility. Soldiers evaluate terrain to examine soils, studying the susceptibility to slope failure and the angles at which failure is likely to occur. They also study known fault zones, looking for silts and sands and making predictions of maximum impact of seismic activity, and examine flood-prone areas to gather historic data on severe floods.
When the United Nations and NATO peacekeeping troops were in Bosnia,
the British soldiers needed to widen and maintain roads through mountains,
an assignment they werent used to doing, says Nathanail. An aide memoire,
focusing on geology, explained how to protect the slope beneath a road,
to provide for drainage, and to avoid disposing spoil over the slope. In
addition, they learned to take advantage of existing fractures to form
slopes and to avoid excess blasting. Finally, the soldiers learned that
persistent, clay-filled discontinuities could be the most dangerous. Without
the geologic advice, says Nathanail, the army would have had much greater
difficulty constructing the roads that were essential to their mission
in Bosnia.
D.W.
The rock record tends to smooth out what are actually a number of very discrete events, says Marcia McNutt, president of the Monterey Bay Aquarium Research Institute. Were going to have to go about our research in a way we havent done before. McNutt and other oceanographers reviewed the past and future of their science during a symposium, Fifty Years of Ocean Discovery, held last October at the National Academy of Sciences in Washington, D.C. The symposium celebrated 50 years of National Science Foundation (NSF) support for oceanographic research.
Submarine warfare during World War II demanded a better understanding of the oceans and led to the development of the science of oceanography. The Office of Naval Research funded oceanographic studies until NSF became the principal funder. Now oceanographers say they are feeling the pressure from society to answer complex questions and conduct comprehensive research with relatively small budgets. The oceans are a crucial part of the nonlinear systems that form the interactions among the lithosphere, biosphere, atmosphere, and hydrosphere. At the same time, oceanographers must study in an environment that can be as inaccessible as outer space.
Developments in the understanding of the ocean have followed and not preceded technology, says Walter Munk, a leading oceanographer since the 1940s and emeritus research professor of geophysics at the Scripps Institution of Oceanography. Scientists are developing new technologies to help them research the ocean at relatively low costs.
Into the ocean
Multidisciplinary teams of researchers are developing undersea observatories;
creating computer models of ocean systems; assembling records of past climate
changes from Ocean Drilling Program cores; deploying unmanned AUVs in deep-ocean
regions; and looking at global ocean temperatures, currents, and biological
densities through the all-seeing eyes of satellites like the National Aeronautics
and Space Administrations Sea-viewing Wide-Field-of-view Sensor (Sea WiFS).
The first satellite view of the ocean came from the Coastal Zone Color
Scanner in 1978 and showed us that oceanography suffers from a terrible
undersampling problem, said Richard Barber of Duke University.
At the same time, sampling is taking a new turn. Oceanographers traditionally used Nansen Bottles to sample ocean water. The samples were studied in the lab, away from the ocean and its systems. Now scientists and their measuring devices are getting right into the water, collecting data constantly over time from a machine or buoy stationed in the ocean or from a satellite that can view thousands of sea miles at once. We can only see everything by going into the ocean in person, Barber said.
Underwater laboratories
An example of an in situ ocean laboratory is the Hawaii-2 Observatory
Seismic System, which sits on the ocean floor midway between the coasts
of California and Hawaii. The seismometer is connected to a box that can
also hold instruments that measure water temperatures, chemistry, and current
velocities. Powering the box is an unused but still functioning undersea
telephone cable that stretches 2,000 miles from Hawaii to California, enabling
the seismometer to make constant measurements over time and transmit data
back to labs at the University of Hawaii. Hawaii-2 is the first of many
seismometers that
scientists hope will develop into the Ocean Seismic Network (Geotimes,
August 1998).
Researchers at the University of Hawaii gathered three months worth of data from HUGO, the Hawaii Undersea Geo-Observatory. The ocean-floor observatory sends data from the summit of the Loihi underwater volcano (1,200 meters down) to the Big Island of Hawaii through a 47-kilometer fiber-optic cable. Led by Fred Duennebier, the Hawaii team presented HUGOs initial findings during the December American Geophysical Union meeting in San Francisco. The system broke down in April because the cable could not withstand the rough terrain, Duennebier says. The team hopes to have a new cable in place this month.
Monitoring the Atlantic Ocean is the Long-Term Ecosystem Observatory
(LEO-15), which includes scientists from Rutgers University and Woods Hole
Oceanographic Institution. It is the worlds first long-term undersea observatory.
A cable stretches from the shore to the observatory, which sits in 15 meters
of water 9 kilometers from the New Jersey coast. As with Hawaii-2 and HUGO,
the cable powers the observatory and carries data to the laboratories.
K.B.
The study
The last major evaluation of NSF earth-science programs occurred in
1984 with the NRC report, Opportunities in the Earth Sciences. According
to NSF Director of Earth Sciences Ian MacGregor, the report focused on
style not substance by making broad recommendations, such as emphasizing
the importance of facilities and a multidisciplinary focus. Since then,
the NSF has worked to implement the recommendations, with minor adjustments,
and has achieved most of its goals.
Seeking a new set of directives, NSFs Division of Earth Sciences asked the NRC to conduct an assessment of the solid earth sciences in 1997. The committee, comprised of 14 members from a broad range of geoscience subdisciplinary backgrounds, will be chaired by Massachusetts Institute of Technology Seismology Professor Thomas Jordan. According to their staff director, Anthony deSouza, the committee will identify a small number of research priorities rather than a laundry list of topics that need attention. Although the committee will focus on basic research within NSF, it may also examine the links between research and societal needs as well as topics of interest to industry and the international community. The study is scheduled to be completed by late 2000, although deSouza anticipates that it may be completed earlier. This study coincides with several other NSF assessments. NSF is conducting an agency-wide study, Grand Challenges in Environmental Science, and the Geoscience Directorate is plotting its own future in a study, GeoVision 2000.
GSA session
The 10 geoscientists speaking at the GSA session, Research Opportunities
in the Earth Sciences: A Ten-Year Vision, emphasized many different disciplines,
but most agreed that future growth in the geosciences will occur in integrated
areas not along traditional disciplinary boundaries. In her talk, GSA
President and Rutgers University Professor Gail Ashley said that research
in the next decade must be both multidisciplinary and interdisciplinary,
linking scientists from many disciplines together. She identified seven
research areas that fall into these categories, including analysis of the
surface-to-bedrock zone, dynamics of the cold region, biogeology, and periods
of abrupt climate change. USGS geophysicist Mary Lou Zoback presented a
paper by U.S. Geological Survey Associate Chief Geologist Steve Bohlen
predicting that the next 100 years could be the century of earth science.
Zoback mentioned three integrative activities that must be accomplished
to achieve this goal: understand the surface of Earth as a coherent air,
land, and water system; unify the geologic, biologic, and ecological sciences;
and develop a synergy among federally funded research programs. University
of Virginia Professor George Hornberger, who chairs the NRC Commission
on Geosciences, Environment, and Resources, presented an overview of recent
studies from the commission. He noted that common themes throughout many
of the studies are the importance of interdisciplinary research, coordinated
long-term datasets, and new measurements. Other talks examined paleobiology
and the interface between biology and geology in isotope ecology as interdisciplinary
areas that need further study.
Vic Baker, professor of planetary sciences at the University of Arizona,
and other speakers emphasized how the rationale for scientific research
has moved away from defense priorities since the end of the Cold War. Baker
also spoke about the blurring of the line between the basic and applied
sciences. David Simpson, president of the Incorporated Research Institutions
for Seismology, pointed to the advances in seismology that have been made
since the collapse of the Soviet Union and the resulting increased opportunities
for data collection and international collaboration.
Kasey Shewey White, AGI Government Affairs Program
During Earths glacial periods, the atmosphere contained a great deal more dust than it did during warmer eras. For some time, it has been known that the concentration of dust falling on high-latitude ice caps varied greatly, and that high concentrations reflected glacial periods, say Pierre Biscaye and Francis Grousset, scientists at Columbia Universitys Lamont-Doherty Earth Observatory and Frances Université de Bordeaux, respectively. But they wanted to know why this was true. So, they and their French and Danish colleagues embarked on a study to determine the provenance, or place of origin, of dust contained in ice cores from Antarctica and Greenland.
The causes of extreme variations in the dust record have been the subject of more speculation than analysis, they wrote in the international newsletter PAGES (Past Global Changes) in August 1998. The approach that we have taken to the solution of this problem is that the first step must be to determine from what continental locations the dust has come. In other words, knowing where the dust came from and where it ended up is the first clue to determining the ancient path of transport, and whether the variations were due to changes in the extent of arid source areas or to changes in wind intensity, or both. The long-term goal: a better understanding of paleoclimate and atmospheric paleocirculation.
In October 1998, Biscaye presented the groups research at the Geological Society of Americas annual meeting. Entitled Mineralogical and Isotopic Tracers of Aeolian Dust in Ice Caps and Marine Sediments, his talk focused on the tracers they used to determine the origin of dust in two ice caps. Dust in the East Antarctic Dome C and Vostok ice cores was analyzed first, followed by dust extracted from the Greenland summit ice cores (GISP2 and GRIP). The samples were compared with wind-deposited or wind-blown samples from PSAs Possible Source Areas.
The tracers for this comparison must be distinctive to the source area. The scientists used both clay mineralogy (reflecting the source-area climate) and radiogenic isotope composition (reflecting lithology and geologic age of the rocks from which the source area sediments were derived) to constrain the origin of the ice-core dusts. Plotted on one of several kinds of graphs, the samples clearly show whether or not they are from the same areas.
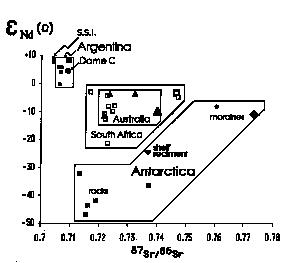 In their first
attempt in 1992, the group took a sample of dust from the last glacial
maximum (LGM) section (18,000 years B.P.) of the East Antarctic Dome C
ice core. They compared this sample with samples from other conti-nental
areas of the globe that were nearest, such as local Antarctic sand dunes,
Australia, southern Argentina, and southern Africa. The strontium (Sr)
and neodymium (Nd) isotopic ratios from all the samples were plotted on
an eNd(o) vs.
87Sr/86Sr isotope composition diagram. (The eNd(o)
notation is a convenient representation of the 143Nd/ 144Nd
ratio.) The isotope composition fields of southern Africa and Australia
overlap, but are distinctly different from those of Antarctica and South
America (Argentina). The Dome C dust sample falls clearly in the last field,
as does the dust from all other samples from East Antarctica, going back
almost 200,000 years B.P. According to Biscaye, the dust from Dome C (and
Vostok) therefore originated in southern Argentina and was transported
to Antarctica through the atmosphere.
In their first
attempt in 1992, the group took a sample of dust from the last glacial
maximum (LGM) section (18,000 years B.P.) of the East Antarctic Dome C
ice core. They compared this sample with samples from other conti-nental
areas of the globe that were nearest, such as local Antarctic sand dunes,
Australia, southern Argentina, and southern Africa. The strontium (Sr)
and neodymium (Nd) isotopic ratios from all the samples were plotted on
an eNd(o) vs.
87Sr/86Sr isotope composition diagram. (The eNd(o)
notation is a convenient representation of the 143Nd/ 144Nd
ratio.) The isotope composition fields of southern Africa and Australia
overlap, but are distinctly different from those of Antarctica and South
America (Argentina). The Dome C dust sample falls clearly in the last field,
as does the dust from all other samples from East Antarctica, going back
almost 200,000 years B.P. According to Biscaye, the dust from Dome C (and
Vostok) therefore originated in southern Argentina and was transported
to Antarctica through the atmosphere.
A similar experiment with the Greenland cores showed the researchers
that dust contained in the GISP2 (Greenland Ice Sheet Project 2) ice core
from Summit, Greenland, originated in eastern Asia. At the GSA meeting,
Biscaye reported that the GISP2 core dust contained almost no smectite,
and had a low kaolinite to chlorite ratio, indicating a high-latitude provenance.
The isotopic compositions of strontium, neodymium, and lead all confirmed
the origin as eastern Asia
particularly China and Mongolia. The group is currently working on
dust from western Antarctica and from annual layers of snow over the past
decade in northern Greenland.
The use of tracers, and particularly of multiple tracers, is a good
way to determine provenance, Biscaye concluded. And knowing the source
area is the key to future research on how global atmospheric circulation
has changed over time.
D.W.
A special symposium at the Geological Society of America (GSA) meeting in Toronto last October gave the IDIG participants a chance to reconvene and report on their individual projects, and to hear what the other teams were doing. Eleven teams, from the 1997 and 1998 summer workshops, provided reports and updates.
In most cases, teams are composed of groups of professors from a college or university, although a team from the Illinois State Geological Survey also participated this year (see Geotimes, August 1998). Its also possible for professors particularly if they are the only geoscience faculty member at their college taking part in IDIG to join up with teams at other institutions, with nongeoscience professors at their own institutions, or with high-school teachers.
Team reports
Many different kinds of colleges and universities are involved in IDIG,
from traditional four-year institutions to colleges for nontraditional
students to two-year colleges. The College of Alameda, Chabot College,
and Las Positas College, all two-year community colleges in northern California,
are members of the College of Alameda Team. Because of another commitment
the members were run-ning a workshop on Geographic Information Systems
(GIS) that week the team could not travel to Toronto, but they did send
an update report to the meeting.
Rita Haberlin of Alameda reported, [The workshop] is an opportunity to showcase [the] new computer facility that we are using for web-based labs in geoscience. We are also gradually introducing students to GIS in our lab classes. ... I want to reassure [you] that we are continuing to redesign the way we teach and are benefiting from the opportunity to attend IDIG as a team. ... I went to Texas and participated in the First National GIS Teacher Training Institute. ... We have also shared our skills with other teachers in various staff-development workshops.
The College of Charleston (S.C.) team is also working on improving lab classes in the geosciences. Charleston is a four-year, liberal arts, state-supported college with 10,000 students. More than 1,000 of them take geology classes each year in a department with 11 faculty members. The Charleston team is focusing on its introductory course, GEOL 101, says Leslie Reynolds Sautter, a geology professor at Charleston. There are so many sections taught by different professors that there is discontinuity in the lectures. Professors can choose their own books and lectures, so every lab has to start from scratch, assuming zero knowledge on the students part, since the students didnt have the same lectures. Sautter described the facultys plan to link the lectures and labs by having a professor teach a lecture, and then have the same students in two labs. The pilot sessions will start in the spring.
Montclair State University, in Upper Montclair, N.J., also has 10,000 students, with about 1,000 students enrolled in geology courses. But a considerable percentage of the student body is made up of nontraditional or part-time students. The geology department has tried new approaches to improve delivery and enhance the program. Students have jobs and family commitments, which causes problems for scheduling labs and field trips. Montclairs Jonathan Lincoln told the IDIG group that the geology faculty is exploring ways to change the design of the courses to alleviate some of the disconnection that occurs as the nontraditional student moves from class to work to home. They are also experimenting with new ways to do field work; the students in one section now do some of their lab work outside, collecting data for later use in lab. And families are included on many of the field trips. Lincoln also reported that a new web page includes exam results, homework assignments, news, and current events, allowing students to stay up-to-date on their work.
Lake Superior College in western Michigan, although not a member of IDIG, attended the symposium and asked the teams questions about designing a geoscience curriculum from the ground up. Advice from IDIG participants ranged from the need to analyze ones existing program (departments should determine what their approach is, what they want their content to be, and what their modes of delivery are) to assessing the program. An important question that the Lake Superior staff needs to answer is whether to emphasize content knowledge (facts and figures of geology), skill knowledge (technical ability and problem-solving), or both, suggested IDIG participants.
IDIG is well on its way to accomplishing its goals of systemic change
in classes and curricula. The teams are geared up for yet another year
of hard work, and are looking forward to next summers workshops. For more
information on IDIG and about participating in its workshops and programs,
contact the American Geological Institute.
D.W.
Linde and Sacks, both of the Department of Terrestrial Magnetism at
the Carnegie Institution of Washington, became interested in the problem
of earthquake-triggered volcanism, or triggered seismicity, after the 1992
Landers earthquake in Southern California. Landers triggered an episode
of deformation at the Long Valley caldera [and] we are rather confident
that the deformation transient was what produced the triggered seismicity
in the Long Valley area, says Linde. To
support their hypothesis, the researchers searched through the historical
records of earthquakes and volcanic events.
Linde and Sacks first analyzed the U.S. Geological Survey National Earthquake Information Center compendium just looking for the really big guys (earthquakes of Richter magnitude 7.0 and above). For each large earthquake, Linde and Sacks then searched the Smithsonian Glob-al Volcanism Program catalog for volcanic events within various distance and time separations. In order to exclude small-scale eruptions, Linde and Sacks only recorded volcanic eruptions that possessed a volcanic explosivity index greater than or equal to 2 (out of a possible 8). Upon plotting their results, Linde and Sacks discovered a significant correlation: 20 volcanic eruptions occurred within two days of nearby earthquakes. While most of the triggered eruptions were within a relatively close range, several were triggered from distances as great as 750 kilometers. In addition, the researchers found a mechanism for eruption pairs volcanoes that are separated by a substantial distance, yet erupt in close succession. Linde and Sacks believe that the seismic energy produced by an erupting volcano may activate nearby volcanoes through triggered seismicity, even at distances of 200 kilometers.
Prompted by the Landers quake, several scientists have proposed theories to explain why seismic activity may trigger a volcanic eruption. For example, scientists have proposed that triggered seismicity could result from a static (permanent) increase in compressive strain at a volcano. However, Linde believes that this is an unlikely explanation for volcanoes greater than 200 to 300 kilometers away, where static strain field changes are far too small to be a likely candidate. Linde and Sacks propose a mechanism that focuses specifically on seis-mic waves. While earthquake-induced changes in static strain diminish relatively quickly over great distances, seismic waves maintain significant strengths for hundreds of kilometers. Linde and Sacks believe that the arrival of seismic energy at a caldera may disturb incorporated gases, causing them to rise in the magma chamber. If the chamber is a relatively sealed system, the rising gases will increase pressure to an unstable level, triggering a volcanic eruption.
Linde and Sacks are collecting new seismic data from modern volcanoes
in an attempt to gain a better understanding of triggered seismicity and
other eruption phenomena. In collaboration with fellow physicists and geologists,
they are planting instruments on Vesuvius, Long Valley, Mauna Loa, and
other volcanoes. Using such techniques as deep borehole tilt with strainmeters,
the researchers are searching for a clearer understanding of the mechanics
of the magma chamber. Although expensive, the experiments may lead scientists
to a better understanding of the overall physics of eruptions.
Joshua A. Chamot
Department of Geology, University of Tennessee, Knoxville
 |
Geotimes Home | AGI Home | Information Services | Geoscience Education | Public Policy | Programs | Publications | Careers |