Geotimes
News Notes
Ecology
Watching the planet green

A new generation of satellites is allowing scientists to, every week, watch the grass grow, literally. Combining Moderate Resolution Imaging Spectroradiometer (MODIS) data of vegetation density with digital data of global weather observations, they can see Earth’s metabolism — the rate at which plants are absorbing carbon out of the atmosphere. NASA scientists have taken this new measurement, called net primary productivity (NPP), and created a set of animations for the 2001 and 2002 growing season.

This false-color map for 2002 shows Earth’s net primary productivity on the land and in the ocean — the rate at which plants absorb carbon out of the atmosphere. The yellow and red areas show the highest rates, ranging from 2 to 3 kilograms of carbon uptake per square meter per year. The green, blue and purple colors show progressively lower productivity. These data combined with recently analyzed historical data show that the Amazon is the area with the highest growth rate over the past 20 years. Image courtesy of NASA.

“Imagine if every week you went out and took a little digital picture of your garden — you would see it grow week by week and then it would reach maturity and then it would senesce until it snows or freezes. You’d see the growing season through the year — that’s what we’re doing for the entire biosphere,” says Steve Running, MODIS science team member and director of the Numerical Terradynamic Simulation Group at the University of Montana.

Studying the planet’s NPP on a weekly basis could help scientists understand more about Earth’s carbon cycle and could also be a foundation for monitoring desertification, droughts and various impacts of climate change.

In the June 6 Science, Running and colleagues analyzed historical productivity data from a past generation satellite, AVHRR, covering from 1982 to 1999. “When you combine the Science paper with the two years of MODIS data, we see that the NPP of the terrestrial biosphere has increased over these 20 years. The world really has gotten more productive in plant growth, and the Amazon has had the highest increase in productivity rate,” he says.

They found that since 1982 the NPP is up 6 percent globally and is up 20 percent in the Amazon, which stands out on the new 2002 NPP map. Their historical data suggests that the productivity in the Amazon is accelerating faster than in areas of the northern high latitudes, such as Alaska and Canada, previously thought to be the fastest growing terrestrial carbon sinks. The leading cause of the global productivity increase, the Science authors suggest, is climate change with some contribution from carbon dioxide fertilization and forest regrowth.

The new MODIS capabilities are the future of global monitoring systems, Running says. Already, for example, he and his counterpart on the oceanic side, Wayne Esaias of NASA Goddard, are learning more about the time dynamic of vegetation growth on the land versus in the ocean. “What I’m looking forward to here is really monitoring global habitability, at the largest level of earth systems science. We’ve had for many decades a regular monitoring system for weather and hydrology,” Running says. “We’ve never had a consistent stable measure of anything about the biosphere … until this.”

Lisa M. Pinsker

Geotimes Home | AGI Home | Information Services | Geoscience Education | Public Policy | Programs | Publications | Careers
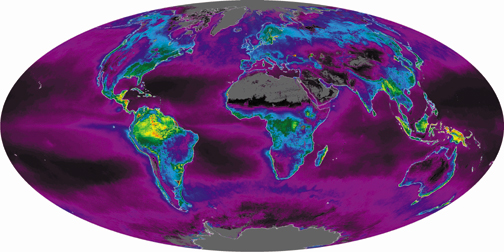
© 2024 American Geological Institute. All rights reserved. Any copying, redistribution or retransmission of any of the contents of this service without the express written consent of the American Geological Institute is expressly prohibited. For all electronic copyright requests, visit: http://www.copyright.com/ccc/do/showConfigurator?WT.mc_id=PubLink