
 Since the 1989
identification of this huge melting event, called global meltwater pulse IA
(mwp-IA), researchers have been trying to deduce the origin of the meltwater.
The lead suspect is the large Laurentide ice sheet over North America. As the
largest ice sheet of the time, Laurentide would have produced enough meltwater
to create the large rise in sea level. But a team of glaciologists and geophysicists
now says that meltwater “fingerprinting” evidence implicates the Antarctic
ice sheet as another culprit.
Since the 1989
identification of this huge melting event, called global meltwater pulse IA
(mwp-IA), researchers have been trying to deduce the origin of the meltwater.
The lead suspect is the large Laurentide ice sheet over North America. As the
largest ice sheet of the time, Laurentide would have produced enough meltwater
to create the large rise in sea level. But a team of glaciologists and geophysicists
now says that meltwater “fingerprinting” evidence implicates the Antarctic
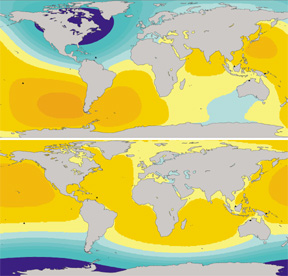
ice sheet as another culprit.This model by Peter Clark and others shows the possible sea-level change that would result from melting of (top) the southern one-third of the Laurentide Ice Sheet and (bottom) West Antarctica, at the onset of the mwp-IA event. Dark blue contouring represents regions where sea level is predicted to fall, and lighter shades of blue denote areas where the predicted sea-level rise is smaller than the global value (20 meters). Zones where the sea-level rise exceeds 20 meters, in yellow-tan contours, balance the predicted mean sea-level rise so it equals the global value.
Reporting in the March 29 Science, Peter Clark of Oregon State University and his team of researchers from the University of Toronto and the University of Durham in England present a new sea-level reconstruction model that tests sea-level measurements and details ice sheet behavior that occurred thousands of years ago. “Identifying the source of this event also helps us to better understand the dynamics of the ice sheet responsible for it,” Clark says.
Although the Laurentide ice sheet was large enough to create the sea-level rise, isotopic evidence from the areas of possible drainage only supports a melting of the southern part of the sheet. The size of the meltwater pulse would have required that the entire section of the sheet melt away — a scenario unsupported by geological evidence. Furthermore, Clark, says, most models suggest that putting such a large amount of freshwater into the Atlantic Ocean would create massive climatic changes.
“Attributing a source of mwp-IA to one or more of the Northern Hemisphere ice sheets has generally posed a problem because all the meltwater would have entered the North Atlantic, and would have caused a large and essentially instantaneous response of a substantial reduction in formation of North Atlantic Deep Water,” Clark says. That would have caused a major shift in the ocean’s circulation pattern, effectively cooling Europe. However, the next major cooling event did not occur until 1,500 years later.
For these reasons, “The southern part of the Laurentide ice sheet could not have been the only place that meltwater came from,” says co-author Jerry Mitrovica of the University of Toronto. Researchers, he says, needed a test to evaluate each possible scenario and identify the ice sheet responsible for the mwp-IA. So Mitrovica and his colleagues developed a model that maps out the geographic variation in sea-level rise, or the fingerprints of the meltwater pulses each ice sheet would have left behind.
When an ice sheet melts, it does not create a geographically uniform sea-level rise, Mitrovica explains. In the vicinity of an ice sheet, the mass of the sheet creates a gravitational pull on the water, pulling it toward itself. When the sheet melts, that pull disappears; water moves away, decreasing sea level near the sheet and increasing it away from the sheet.
“And it turns out that if the [Laurentide] ice sheet melted in Canada, then the sea-level rise at Sunda Shelf should be 70 percent larger than the sea-level rise in Barbados.” But the observed sea level responses from sediment data at Barbados and the Sunda Shelf in Vietnam show no difference between the two sites, each with about a 20-meter rise. Applying the model to the melting of the Antarctic ice sheet, however, they found a fingerprint that matched the observed sea-level rise at both locations. That’s why, Mitrovica says, they believe the Antarctic ice sheet was likely the main perpetrator with additional possible melting from the Laurentide sheet.
“Attributing the source to the Antarctic ice sheet underscores the potential vulnerability of ice sheets to global warming,” Clark says, explaining how the deglaciation 14,000 years ago conceptually parallels today’s climate. An extended period of warming in much of the Antarctic region and parts of the Southern Ocean preceeded mwp-IA. Atmospheric carbon dioxide and global sea level had also been increasing. But he adds that the Antarctic ice sheets today are configured differently now than they were before mwp-IA, so their response to these trends are unlikely to be the same. Nevertheless, correctly modeling past ice sheet behavior will help researchers to better understand how ice sheets might behave in the future, Clark says.
Richard Alley, a glaciologist at Pennsylvania State University, says that this mwp-IA research gets to the heart of understanding the Ice Age world. Although, Alley says, the fingerprinting model lacks fine time resolution compared to other sea-level reconstruction models, he adds that it shows clearly that the Laurentide ice sheet could not have been the sole culprit in mwp-IA. But most importantly, Alley says, the new model will motivate more research. “If we have a few more really good sea-level records, we’ll be able to learn so much.”
Lisa M. Pinsker
