
 Have
you heard? El Niño is back again. Or is it? This climate event, a warming
of the eastern Pacific, occurs every two to seven years, but doesn’t always
capture the headlines or grab the attention of the general public.
Have
you heard? El Niño is back again. Or is it? This climate event, a warming
of the eastern Pacific, occurs every two to seven years, but doesn’t always
capture the headlines or grab the attention of the general public.
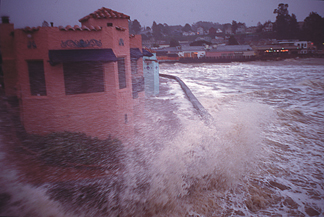
In February 1998, high-tide waves crashed against the seawall at an apartment
complex in Capitola Beach, one of many powerful winter storms along the California
coast attributed to El Niño. At least 27 counties in California were
declared national disaster areas, with hundreds of millions of dollars in property
losses. El Niño is the biggest player in seasonal climate predictions,
and predicting the start of an El Niño itself and what effect it will
have on global climate is difficult. Courtesy of Bruce Richmond, USGS.
During the winter of 1997-1998, the world was abuzz with El Niño, as
the Pacific reached temperatures never before recorded. Most of the population
of the United States was directly affected by that El Niño, and although
scientists predicted it was on the way months in advance, they could not accurately
predict its exact timing, and they well underestimated its strength.
Prediction capability has since improved, but there are still obstacles scientists
must overcome to relay their predictions to decision-makers and the general
public. There remains a general lack of understanding about El Niño,
which is made worse by the fact that the warming of the Pacific is itself not
very important to most of the world — people only care about what happens
in their backyard. As a result, scientists must do a better job of communicating
the likely effects from a given El Niño.
Simple beginnings
The story of El Niño begins in coastal Peru, where many people make their
living fishing the Pacific Ocean. Rising waters in the far eastern Pacific bring
low temperatures and abundant nutrients to the surface — conditions ideal
for fish. In the winter, however, a southward-flowing warm current disrupts
this balance. Peruvian fisherman have traditionally referred to this warming
as El Niño or “Christ child,” as it often coincided with Christmas.
Now scientists refer to warm anomalies at any time of the year that occur over
a span of several months as El Niño. During these events, the warming
is enough to bring an end to the vast fish population and wreak havoc on the
Peruvian economy. To top it off, the warm waters are often accompanied by copious
rains, which are uncommon in this part of the world, leading to flash floods
and landslides.
Over the years, as observations of the Pacific increased, scientists have been
able to connect the local El Niño warming off Peru to the rest of the
ocean basin. In fact the story goes deeper, literally: The warming that the
fishermen experienced at the surface was also occurring at some depth. A deep
layer of warm well-mixed water, called the mixed layer, is usually confined
to the western Pacific near Australia, but during El Niño this water
sloshes to the east. Scientists also began to realize that the ocean-circulation
alone could not explain the El Niño phenomenon.
Looking for clues to predict the Asian monsoon in the 1920s, G.T. Walker found
a seesaw of atmospheric pressure between the eastern and western Pacific, which
he called the Southern Oscillation. Normally, pressure is low in the western
Pacific and high in the eastern Pacific, with easterly winds connecting these
centers. The pressure centers, however, can be strong some years and weak in
other years.
In the late 1960s, J. Bjerknes made the connection between the Southern Oscillation
and El Niño. During normal years, the pressure difference between the
eastern and western Pacific Ocean is strong, and easterly winds pile up warm
waters near Australia. During El Niño, the pressure difference is weak
or even reverses. The resulting decrease in easterly wind no longer forces the
water to the west, and the warm water makes its way toward South America. By
the early 1980s, scientists had a pretty good picture of the El Niño-Southern
Oscillation event, which is often shortened to ENSO, but understanding the cause
of El Niño is still somewhat of a mystery, making prediction a tricky
business.
Taking the ocean’s temperature
 An advantage in
trying to predict an El Niño is the slow evolution of sea-surface temperature.
Weather is often chaotic and changes quickly, making predictions beyond a few
days difficult. But the ocean changes at a much slower pace, so it takes a season
or more for an El Niño to fully mature.
An advantage in
trying to predict an El Niño is the slow evolution of sea-surface temperature.
Weather is often chaotic and changes quickly, making predictions beyond a few
days difficult. But the ocean changes at a much slower pace, so it takes a season
or more for an El Niño to fully mature.
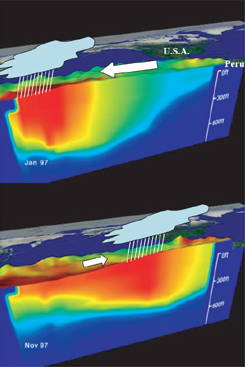
Satellite images show temperatures of the upper layer of the ocean for January
1997 — a normal month — and November 1997 — an El Niño
month. During normal conditions, winds (white arrow) cause an accumulation of
warm waters in the western Pacific, leaving cooler waters in the east. Rain
preferentially forms over the warmest waters. During the 1997-1998 El Niño,
the wind reversed direction and the warmest water and rainfall moved eastward,
affecting the Peruvian people and weather around the world. Satellite images
courtesy of NASA Goddard Space Flight Center.
The disadvantage in trying to predict an El Niño is that the phenomenon
is part of an atmosphere-ocean interaction (a coupled system). You need two
to tango. The number of atmospheric and oceanic predictors are large and many
are either not well-observed or have a tenuous link to the phenomenon. In addition,
computer models that truly couple the atmosphere and ocean are relatively new
and primitive.
The object of the majority of ENSO forecast models, whether they be statistical
or dynamic, is to forecast temperature anomalies in the Pacific. Oftentimes,
they are compared based on their prediction of the “Niño 3.4 index,”
which is the average sea-surface temperature anomaly for a location in the central
Pacific. This location marks a significant geographical shift from the roots
of El Niño in coastal Peru, but the central Pacific is where the climate
change of the Pacific is most pronounced, or in other words where ENSO is strongest.
Statistical models combine a set of climate variables through various statistical
techniques to produce either a field of data or just one value (for example,
the Niño 3.4). Dynamical models use the physics of the atmosphere and
ocean to try and represent reality. They usually generate fields of temperature
as well as other variables.
Right now, statistical and dynamical models do equally well (or poorly, depending
how you look at it) in predicting El Niño. Likely, dynamical models will
one day be superior to statistical models and show a level of skill, as computer
power increases and we better understand how the ocean and atmosphere communicate
with each other.
Global consequences
The relationship between El Niño and the people of Peru is unique in
the sense that the El Niño itself (the warm Pacific) and a subsequent
effect of El Niño (flooding) both affect the population. Most of the
world, however, is not directly affected by a warm ocean near the equator, but
instead views El Niño through the window of its global effects.
In the 1980s, with increased globalization and satellite images, scientists
began piecing together the effects of El Niño. The reason that El Niño
is not just a Pacific problem is because the warming is widespread and the heat
that is generated (equivalent to about 4,000 times the energy of the Dec. 26
earthquake that set off the tsunami in the Indian Ocean) causes a ripple effect
in the atmosphere, changing the large-scale circulation and storm tracks.
Areas that are usually dry become wet and vice versa. Heavy rains accompany
the warming and weakening of the high pressure in the eastern Pacific. Indonesia
and northern Australia experience drought and often raging fires, as the western
Pacific low pressure center weakens. The horn of Africa becomes wet, and northeast
Brazil dries out. In the United States, more rain falls on California and the
Southeast. (The recent increase in floods and landslides in California, however,
does not appear to be related to the El Niño.) As the El Niño
peaks in strength, many of the effects are felt in the tropics first and then
“ripple” poleward. Other regions are preferentially affected during
certain seasons, and some parts of the planet show no connection to El Niño
at all.
El Niño is often perceived as producing only bad weather. Little is ever
said about the positive effects of El Niño — one being the decrease
in the number of Atlantic hurricanes. In fact, hurricane prediction models use
the state of El Niño as one of the input variables. While the 2004 hurricane
season was one of the worst on record, the developing 2004-2005 El Niño
should be partly credited for a quiet October and November (see sidebar).
Furthermore, one study in the Bulletin of the American Meteorological Society
calculated that more human lives were saved than lost, and there were more economic
gains than losses as a result of the 1997-1998 El Niño.
While some effects are well-known, others are pure invention, which lead to
misconceptions within the general public. For example, El Niño is blamed
for weird weather and economic and human losses that occur during the event,
prompting people to ask, “exactly what isn’t El Niños fault?”
While there does seem to be evidence for an increase in worldwide precipitation
extremes during El Niño, it is impossible to blame a single storm or
outbreak of severe weather on the phenomenon. This is similar to the fallacy
that one warm summer is a sign of global warming.
Finally, it is important to remind ourselves that every El Niño is unique.
The magnitude and areal extent of warm waters changes from event to event. These
factors, in turn, determine if and how the atmosphere changes and whether a
certain spot on Earth will feel some effect. Even with these caveats, El Niño
is the biggest player in seasonal climate predictions, which give forecasts
in percent chance of being dry or wet, warm or cold, over a season or more.
The 2004-2005 El Niño?
The 1990s can be considered the decade of El Niño. Warm conditions were
observed almost every month from 1990 to early 1995, and the strongest El Niño
on record occurred in 1997 and 1998. This event led scientists to explore the
connections between global warming and El Niño. In the process, some
scientists began to observe 20-year variations in the strength and number of
El Niños. If their hypotheses are correct, we should be entering a period
where El Niños will be infrequent and weak.
This pattern seems to be holding true so far, as after the 1997-1998 El Niño,
there was a minor El Niño during the winter of 2002-2003. Now there seems
to be an even weaker El Niño under way. In December 2004, the Niño
3.4 index was 0.85. The Southern Oscillation Index (SOI) was minus 1.8, and
the ENSO Precipitation Index (ESPI) was 0.06. These last two measures indicate
how much the atmosphere is teaming up with the ocean. (For comparison, the December
1997 value of Niño 3.4 was 2.78 degrees Celsius, SOI was minus 2.10,
and ESPI was 2.19.) Data in January showed a weakening of the current El Niño.
This data thus suggest that there may be little to no response in the atmosphere,
and that the global weather effects in the coming months will be minimal.
At this time, the Climate Prediction Center predicts that the 2004-2005 El Niño
will be essentially finished this spring. The spring season forecast for the
United States, however, contains some of the typical lingering effects from
a weak El Niño: for example, wetter than normal conditions in the Southwest.
This is good news for this part of the country, which has been suffering for
a long time under drought conditions.
Predicting the future
Often, El Niño prediction is a matter of reading the tea leaves. A warming
here, a wind disturbance there — each might be harbingers of a coming El
Niño. And recently developed models seek to find the right combination
using new methods.
For example, my colleagues and I have used changes in Indian Ocean precipitation,
estimated by satellites, to determine whether an El Niño will appear
in the coming year. This has been met with success in the prediction of the
last El Niño in 2002, as it appears that climate shifts in the Indian
Ocean precede wind disturbances in the western Pacific (see Geotimes,
May 2002). How ironic that Walker looked to the Pacific’s Southern
Oscillation to predict Indian rainfall, and now scientists are using Indian
Ocean rainfall to predict the ENSO. Other simple models have used wind data
from the eastern Indian Ocean to western Pacific Ocean and the heat content
of the mixed layer in the western Pacific.
Still, El Niño prediction has a long way to go. Given a slight warming
of the Pacific, computer models will often attempt to generate full-blown El
Niño events. Prediction of the 1997-1998 El Niño was considered
unskilled. Although the majority of statistical and dynamical models in use
at the time did “forecast” an El Niño, the timing was off by
several months, and no model predicted the magnitude of the event.
Besides improving the predictions themselves, scientists are beginning to study
how society uses predictions, a function that is influenced by many factors.
A study of the fishing sector in five port towns in Peru found that the perceived
accuracy of the predictions, access to media outlets and the timing of hearing
the forecast were important in the usefulness of the 1997-1998 El Niño
prediction.
Once the forecast is heard, decisions and actions can be made based on how the
El Niño is expected to affect a certain region. While scientists will
continue to rely on what El Niño has done in the past to predict what
will happen in the future, attention must be paid to other environmental factors
that might affect climate. For example, the impacts of the 1982-1983 El Niño,
which was almost equal in strength to the 1997-1998 event, may have been moderated
by the eruption of Mexico’s El Chichón volcano, whose ash sent tons
of climate-cooling pollutants into the stratosphere (see Geotimes,
February 2004).
Better predictions of the effects of El Niño will initially come down
to more detailed observations of our planet, whether from instruments on the
ground or in space. We have a good understanding of how the climate will change
over a season, but we don’t know for certain what extremes in precipitation
and temperature can be expected during the season. This is an area that many
researchers, including myself, are just beginning to tackle.
|
El
Niño and Hurricanes? While many people associate El Niño with increased storminess, the number of Atlantic hurricanes actually decreases during El Niño. The reason for this decline, according to the National Hurricane Center, has to do with the way El Niño changes the atmospheric circulation. Tropical storms form over almost every ocean on Earth, but only the Atlantic storms are strongly affected by El Niño because of a change in the air flow over the Atlantic. During an El Niño, the eastern Pacific is warmer than normal, leading to rising air. When the air reaches the upper levels of the atmosphere, it spreads out, and some of that air moves northeastward over the Caribbean, Gulf of Mexico and Atlantic, mostly south of 30 degrees north latitude. This upper-air flow pattern is in a different direction than the surface winds at these locations, creating what is known as wind shear. Hurricanes hate shear. One of the ingredients for hurricanes is tall, straight columns of clouds. Wind shear tilts the columns of clouds, inhibiting hurricane development. Thus, while the 2004 Atlantic hurricane season was particularly bad in August and September, the reason it was mostly quiet in October and November may have been due to the start of the current weak El Niño. SC Back to top |
 |
Geotimes Home | AGI Home | Information Services | Geoscience Education | Public Policy | Programs | Publications | Careers |