
Around dinnertime on Nov. 10, 1975, the Edmund Fitzgerald sank in Lake
Superior, taking with her 26,000 tons of ore and all 29 men aboard. Less than
a year later, singer Gordon Lightfoot released the song, “The Wreck of
the Edmund Fitzgerald,” thus immortalizing the wreck and turning
it into a legend.
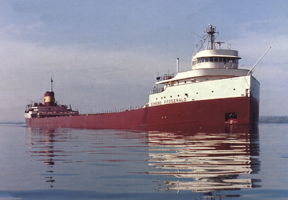
The Edmund Fitzgerald famously
sank in bad weather on Nov. 10, 1975. No one knows exactly what sank her, but
new model simulations — being used in the classroom to draw students’
interest — are showing more precisely what conditions the ship may have
encountered. Courtesy of the Great Lakes Shipwreck Historical
Society.
Although the National Transportation Safety Board (NTSB) never determined the
specific cause of the wreck, weather was surely to blame. Today, in a growing
trend of using human-interest stories to help students relate to science, new
model simulations of the weather conditions surrounding the accident are
providing students with an opportunity to understand the storm that caused the
wreck.
The Edmund Fitzgerald, “the biggest ship at the time, sank in five
minutes,” says Steve Ackerman, a professor at the University of Wisconsin
in Madison (UW) who uses the model simulations in an introductory course on
weather and climate — a class filled with 400 non-science majors taking
it to meet a general education requirement. Because no one really knows what
brought her down, “there’s still mystery and intrigue behind”
the wreck, he says. Everyone likes a good story and a good mystery, “so
intertwining this story and sequence of events with the weather models”
seems to resonate with students.
Whether the ship was flooded by high waves or sunk by structural destruction,
or whether it ran aground or capsized, “we don’t know,” says
Robert Aune, a scientist with the National Oceanic and Atmospheric Administration
(NOAA), stationed at the UW Space Science and Engineering Center,
who developed the new model simulation used in Ackerman’s class. “There’s
a lot of speculation, but we probably won’t ever know” exactly what
happened, he says. But using new models to create simulations of the weather
at the time the ship went down, and comparing them to observations recorded
at the time, will certainly help ascertain what conditions the ship encountered.
The Edmund Fitzgerald, a steel bulk freighter, was 222 meters (729 feet)
long — only 30 meters shorter than the Titanic — and weighed 13,632
tons empty. She had been operating on the Great Lakes since 1958, and was helmed
by a captain with 40 years of experience operating cargo ships. This trip was
scheduled to be the last run of the year.
According to the NTSB accident report, on Nov. 9, 1975, the Edmund Fitzgerald,
fully loaded with iron ore, left port at Superior, Wis., heading southeastward
toward Detroit, Mich. About 30 minutes later, the National Weather Service issued
a “gale warning” — winds higher than 63 kilometers per hour (39
miles per hour) — for Lake Superior, Aune says. By Nov. 10, the weather
service had “pumped up the warning to storm force” (greater than 89
kilometers per hour), Aune says. Waves were undoubtedly growing higher as well,
he says. The storm was growing stronger.
Radio communications between the Edmund Fitzgerald and nearby ships and
land showed that “it was rough out there,” Aune says, but the captain
communicated that things were under control. “We are holding our own,”
Captain McSorley is quoted as saying to a nearby ship that had been following
closely behind the Edmund Fitzgerald. Then suddenly, the ship was gone.
Observations from ships and weather stations in the area indicated that waves
in the southeastern portion of Lake Superior where the ship sank were reaching
7.6 meters (25 feet) high, says Thomas Hultquist, a science and operations officer
with the National Weather Service in Marquette, Mich. Additionally,
wave periods on the lake are always relatively short, he says, which can be
problematic for ships. Some observations indicate that the length between wave
crests may have been as little as 61 meters, Aune adds, so a ship three times
that long could easily be tossed about.
 The
winds and waves were “pretty bad for about 24 hours, but the most severe
conditions only lasted six to nine hours and eerily only affected the one spot
where the Edmund Fitzgerald went down,” says Hultquist, who, independent
of Aune, ran another high-resolution model to recreate and piece together the
conditions on the lake (the results of which are being published next month
in the Bulletin of the American Meteorological Society).
The
winds and waves were “pretty bad for about 24 hours, but the most severe
conditions only lasted six to nine hours and eerily only affected the one spot
where the Edmund Fitzgerald went down,” says Hultquist, who, independent
of Aune, ran another high-resolution model to recreate and piece together the
conditions on the lake (the results of which are being published next month
in the Bulletin of the American Meteorological Society).
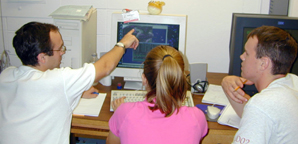
High school students at a University of
Wisconsin-led summer workshop learn about a storm through
a computer model. Using visualizations of everything from landslides to storms,
such as the one that sank the Edmund Fitzgerald in 1975, is gaining ground
as a teaching technique. Courtesy of the Space Science and Engineering Center.
“The ship couldn’t have been in a worse spot at a worse time.”
If weather forecasters in 1975 had the same models that forecasters have today,
he says, it’s possible the ship could have avoided the worst conditions
by switching paths or going through the area a few hours earlier or later.
Both Hultquist’s and Aune’s models rely on a high-resolution dataset
of atmospheric conditions over the past half-century compiled by the National
Center for Atmospheric Research and NOAA. Using this dataset, researchers could
model a number of past events. “Back forecasting” was a fun exercise
not only from a historical perspective, but also from an educational one, Hultquist
says. He uses such model results to train employees new to the weather service
in Michigan to illustrate the type of storms that arise over the Great Lakes,
in much the same way that Ackerman uses Aune’s model to tell the story
of the Edmund Fitzgerald to his UW students.
All across the country, professors are turning more frequently to such visualizations
to “teach from a storytelling point of view,” says Cathy Manduca,
director of the Science Education Resource Center at Carleton College in Northfield,
Minn. In recent years, a wealth of “good research” has been done on
how students learn, which unequivocally shows that students learn best when
they are engaged, she says. “A student’s ability to learn science
can certainly be enhanced by grounding the scientific concepts in a narrative
the students are interested in.”
To that end, Manduca and colleagues have developed a Web site
filled with visualizations — photos, graphs and animated models, for example
— that universities and scientific organizations, such as NASA and NOAA,
have put together to help explain complex topics. Anyone can download the images
and animations for use.
Visualizations on several topics are available, including landslides (put together
following a series of slides in California), plate tectonics, and the two most
popular and newest topics — tsunamis, assembled following the Sumatra quake
and tsunami in 2004, and hurricanes, put together following hurricanes Katrina
and Rita last year. Manduca says that her group has heard from many professors
who have used the visualizations in the classroom to help tell scientific stories.
There can be little doubt, Ackerman says, that coupling stories, such as that
of the wreck of the Edmund Fitzgerald, with science is good. Students
seem to enjoy a good tale, even if tragic, he says, and getting people to enjoy
any aspect of science is a good thing.
Megan Sever
Links:
SSEC
model simulation of the Edmund Fitzgerald storm
SSEC
information on the sinking of the Edmund Fitzgerald
SSEC
summer workshops for students
NWS
Edmund Fitzgerald information
Visualizations
collections
Great
Lakes Shipwreck Historical Society
Back to top
 |
Geotimes Home | AGI Home | Information Services | Geoscience Education | Public Policy | Programs | Publications | Careers |