
 Shortly
after noon on Jan. 10, a massive mudslide swept through the coastal hamlet of
La Conchita, Calif., killing 10 people and destroying or badly damaging 36 homes.
The tragedy became a defining moment in last winter’s wet season in Southern
California. By that time, heavy rains from a powerful system of storms had been
soaking the region for nearly two weeks. Several homes had already been destroyed,
and two people were killed in separate landslides.
Shortly
after noon on Jan. 10, a massive mudslide swept through the coastal hamlet of
La Conchita, Calif., killing 10 people and destroying or badly damaging 36 homes.
The tragedy became a defining moment in last winter’s wet season in Southern
California. By that time, heavy rains from a powerful system of storms had been
soaking the region for nearly two weeks. Several homes had already been destroyed,
and two people were killed in separate landslides.
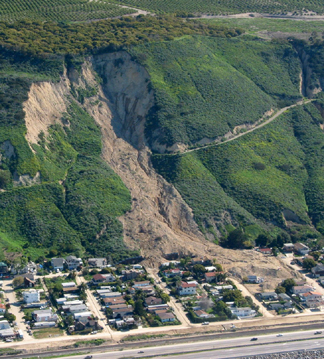
The La Conchita landslide and debris flow
on Jan. 10 caused 10 fatalities and destroyed or damaged 36 homes. The 2005
event remobilized landslide debris from a larger but slower-moving landslide
in 1995, the scar of which is also visible to the left. Image courtesy of Mark
Reid, USGS.
Just 10 days before, the U.S. Geological Survey (USGS) had posted a media advisory
warning of the risk of landslides in Southern California. The National Weather
Service had also issued flash-flood watches and warnings with mudslide advisories.
Both agencies worried that the unfolding situation was rapidly becoming “landslide
weather,” where hillslopes become saturated with rainfall, destabilize
and spawn an abundance of mudslides known as debris flows. The hazardous conditions
persisted into late spring when, on June 1, a larger, deeper, but slower landside
destroyed at least 11 homes in Laguna Beach.
The Southern California losses provide an opportunity to review several lessons
from many years of observing the role of weather in California landslide activity.
As we learned firsthand, understanding weather patterns — the science —
is paramount, but not enough. As evident from the recent tragedy in New Orleans,
we must also better communicate the hazard to the public through effective public
warnings.
The Culprit
Despite popular folklore about California’s “schizophrenic” climate,
its seasonal variations are no more extreme than those elsewhere; they simply
take a different form. New England’s seasonal opposites, for example, are
of temperature, from freezing in December to uncomfortably warm in August, with
an even distribution of precipitation. In coastal California, by contrast, temperature
variation is muted but precipitation varies sharply from summer drought to winter
rainstorms. The term “Mediterranean climate,” often used to describe
California’s weather, derives from a similar pattern in southern Europe
and along the North African coast.
In coastal Southern California, rainfall is rare from June through August, and
uncommon in September and October. Eighty percent of the annual precipitation
falls from November through March. Even in winter, rainstorms are infrequent
(less than one day in four has measurable rainfall). When storms do occur, however,
the rain can be very heavy. For example, 66.34 centimeters (26.12 inches) fell
in 24 hours in January 1943 in the San Gabriel Mountains above Los Angeles —
the statewide record for daily rainfall.
The patterns of winter rainfall in coastal California reflect broad-scale atmospheric
circulation over the northern Pacific Ocean. California lies in the Westerlies,
a global band of eastward-flowing air between latitudes 30 degrees and 60 degrees
north. Weather patterns arise over an expanse of open water, gain strength and
move eastward, eventually making landfall on the West Coast of North America.
Bounding the Westerlies are two perennial barometric features: the Aleutian
Low, a subpolar cell southwest of Alaska, and the East Pacific High, a subtropical
cell off the Pacific coast of Mexico. The jet stream, a narrow east-flowing
band of high-velocity wind in the upper atmosphere, steers storm systems across
the northeast Pacific Ocean toward California.
Precipitation tends to intensify in areas of low pressure and diminish in areas
of high pressure, so persistent barometric conditions in the northern Pacific
make it easier to forecast large winter storms that could trigger debris flows.
During summer, the East Pacific High moves northward, blocking storms traveling
eastward to California. In winter, the high drifts southward, opening a storm
path for the low pressure systems (cyclones) spawned near the Aleutian Low.
The result is California’s wet winters, dry summers and a general decrease
in moisture southward from the Oregon border to Mexico.
Rainfall distribution also is uneven from year to year, especially in Southern
California. Dry years (1975 to 1977, 1986 to 1987, 1989 to 1990), with less
than half the long-term mean annual precipitation, contrast with wet years (1982
to 1983, 1992 to 1993, 1994 to 1995, 2004 to 2005), with more than double the
mean annual precipitation. The wettest years (1982 to 1983, 1997 to 1998) frequently
correlate with high El Niño activity, the driest years (1976 to 1977,
1988 to 1989) with La Niña, the opposite of the El Niño-Southern
Oscillation (ENSO) sea-surface temperature anomaly. However, non-ENSO years
may also bring heavy rainfall.
The weather pattern most likely to trigger dangerous, fast-moving debris flows,
however, is the “Pineapple Express.” In winter, a high-pressure system
over the Gulf of Alaska blocks the polar jet stream, which may split and form
a southerly branch across the mid-Pacific. The polar high may weaken and shift
westward, forcing this southern branch even farther south to form a subtropical
jet. As it slips around the blocking high, the subtropical jet heads northeastward,
across or near the Hawaiian Islands. On its passage through the tropics, the
air mass warms and gathers moisture. Once formed, the Pineapple Express may
persist for several days to more than a week, delivering copious warm, intense
rainfall wherever it makes landfall — as happened in Southern California
in late December 2004.
Moving inland, marine weather systems are modified by the effects of mountainous
terrain. In Southern California, mountains reach elevations exceeding 1,000
meters (3,280 feet) within a few kilometers of the coastline. As a storm system
moves eastward, the air mass rises over this obstruction, cools, and water condenses,
increasing rainfall on the windward side of the range. Long-term rainfall records
at Los Angeles International Airport, near sea level, indicate a mean annual
precipitation of 33.4 centimeters (13.15 inches), while the Mount Wilson Observatory,
at 1,740 meters (5,709 feet) in the San Gabriel Mountains, has a mean annual
precipitation of 102.5 centimeters (40.37 inches).
Descending the leeward side of a mountain range, the air mass warms and condensation
is suppressed, decreasing rainfall intensity and creating a topographic “rain
shadow.” The rain gage at Palmdale, northeast of the San Gabriel Mountains,
shows a mean annual precipitation of only 18.7 centimeters (7.36 inches), a
little over half the value at the coast and less than one-fifth of that at Mount
Wilson.
But to understand California’s landslide climate, a second annual cycle
must also be considered: seasonal variation in the rate of evapotranspiration,
which is the loss of moisture by direct evaporation from the soil surface plus
that transpired by vegetation. Although this drying reflects a complex interaction
of disparate processes, it is most strongly influenced by air temperature and
solar radiation, which both reach a maximum in summer and a minimum in winter.
The soil moisture stored in a hillslope reflects the balance between input of
water from precipitation and loss of moisture from evapotranspiration.
In a Mediterranean climate, the precipitation and evapotranspiration cycles
are about six months out of phase: Precipitation peaks in midwinter, whereas
evapotranspiration reaches its maximum during the summer. The resulting phase
shift yields a variation in soil moisture from fairly arid conditions in midautumn
to near saturation in midwinter. This seasonal contrast profoundly affects the
relationship between rainfall and slope instability in California.
Some older literature refers to “antecedent rainfall,” a minimal amount
of seasonal precipitation needed before debris flows can be triggered by even
intense rainfall. This antecedent rainfall requirement may be a consequence
of the Mediterranean climate. When the rainfall season begins in late October,
hillslope soils are partially dehydrated by the long summer drought. Early seasonal
rainfall is simply absorbed into the soil with little effect on slope stability.
As the rainfall season progresses, soil moisture content increases until the
summer deficit is erased. Subsequent heavy rainfall may saturate the void space
in the soil, creating positive pressures that can destabilize the slope. Typically
in California, the moisture deficit is satisfied near the end of the calendar
year, then remains at or near zero until mid-April, when decreasing rainfall,
warmer temperatures and longer daylight increase evapotranspiration, leading
again to drier soils.
Trigger point
 Two conditions
must be met for rainfall to cause a debris flow: The hillslope must be susceptible
to failure under saturated conditions, and the rainfall must have the intensity
and duration necessary to saturate the ground to a sufficient depth. Efforts
by USGS to mitigate debris-flow hazards address both of these conditions.
Two conditions
must be met for rainfall to cause a debris flow: The hillslope must be susceptible
to failure under saturated conditions, and the rainfall must have the intensity
and duration necessary to saturate the ground to a sufficient depth. Efforts
by USGS to mitigate debris-flow hazards address both of these conditions.
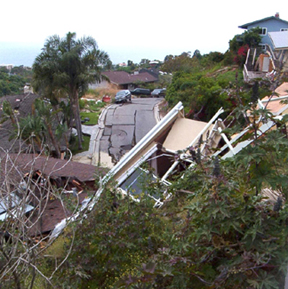
A landslide in Laguna Beach, Calif., on
June 1 destroyed 15 houses and damaged several others, but there were no fatalities
or serious injuries. This neighborhood in Bluebird Canyon also suffered extensive
landslide damage in October 1978. Image courtesy of James Bowers, USGS.
Hillslope steepness has the most influence on debris-flow likelihood, followed
by thickness and texture of the loose material that mantles the slope, and the
mechanical and hydrological properties of the underlying rock. Another contributing
factor is the shape of the hillslope: whether it converges (bowl-shaped or hollow)
or diverges (a ridgeline). The direction the slope faces, relative to both the
prevailing storm winds and to the path of the sun, is also important. Finally,
vegetation on the slope is critical: Slopes laid bare by fire or artificially
cleared are especially vulnerable to erosion and mass wasting; slopes with lush,
healthy vegetation are far more resistant.
Using digital geographic information system techniques, USGS has prepared regional
maps of debris-flow susceptibility in the San Francisco Bay region and, more
recently, in Southern California. These maps are based on measures of topography,
calculated from digital elevation models (DEM). Similar measurements on sites
of historical debris-flow activity, as recorded by aerial photos or field evidence,
provide calibration data. Steep, convergent slopes are the most likely source
areas for debris flows.
Still, persistent uncertainty over exactly how sustained, intense rainfall triggers
shallow landslides has complicated hazard assessments. Generally, scientists
have thought that the soils must be saturated with water for failure to occur.
However, there is some debate as to whether it is the increased pressure from
the water or the movement of the water through the soil that triggers the flow.
More recently, some scientists have even questioned the necessity for saturation;
increasing moisture may loosen the structure of stiff, dry soils enough for
some slopes to fail.
Recent studies in terrain burned by wildfires suggest that some debris flows
may not even require a landslide as a source. Large debris flows have emerged
from stream channels that drain severely burned areas, yet the slopes in the
watershed exhibit no evidence of discrete landslide scars. The mechanism postulated
here is that an extremely high rate of surface erosion carries so much sediment
into the channel that the stream flows as a thick slurry, leaving a deposit
very similar to those of debris flows from landslides.
Despite these differences, it is clear that whatever the mechanism, the production
of debris flows requires intense rainfall, sustained for at least a brief period
of time. For the purpose of forecasting debris flows, therefore, a purely empirical,
historical approach can estimate the intensity and duration of rainfall required.
Such an estimation requires collecting and graphing rainfall data for a number
of large storms, estimated over various durations. Deter-mining threshold precipitation
amounts can form an essential component of a debris-flow warning system.
Late-blooming landslides
Not all slope failures, however, occur immediately after heavy rainfall. In
some of the wettest years, one or more large, deep landslides occurs in the
spring or early summer. Southern California’s 2004 to 2005 rainfall season
provided a spectacular example — the June 1 failure in Laguna Beach that
destroyed 11 homes and damaged several others. Although the late spring had
been cool and wet, not much rain had fallen since February. The December-January
deluge had triggered many debris flows and other shallow landslides throughout
the region, so hydrological conditions were ripe for landsliding at that time
(see Geotimes, April 2005). Why, then, a three-month
delay?
Customary explanations for this delayed response involve either a progressive
failure or a slow rise in the height of the groundwater table. In a progressive
failure, deep movement begins soon after heavy rainfall, but propagates only
slowly along the slip surface until the movement emerges at the top or bottom
of the hillslope. The sudden loss of resistance accelerates the process, causing
the entire slope to fail as a landslide. Alternatively, rainwater may take a
long time to percolate down to an underground surface, and there may also be
slow percolation parallel to the hillslope, leading to a delayed rise in the
deeper groundwater levels. When the levels get high enough, the slope fails.
Whatever the mechanism, late-blooming landslides should be anticipated in the
spring or summer after an exceptionally wet winter.
The warning conundrum
 Since 1982,
when a storm triggered thousands of debris flows and other landslides in the
San Francisco Bay region, killing 25 people, USGS geologists have worked toward
a public landslide-warning system. Most of our efforts have focused on technical
aspects of mapping debris-flow susceptibility and crafting rainfall/debris-flow
thresholds. The National Weather Service has the responsibility for forecasting
storms and their behavior. Beyond distributing general advice, however, we have
not fully addressed the problem of preparing the public to respond to landslide
warnings.
Since 1982,
when a storm triggered thousands of debris flows and other landslides in the
San Francisco Bay region, killing 25 people, USGS geologists have worked toward
a public landslide-warning system. Most of our efforts have focused on technical
aspects of mapping debris-flow susceptibility and crafting rainfall/debris-flow
thresholds. The National Weather Service has the responsibility for forecasting
storms and their behavior. Beyond distributing general advice, however, we have
not fully addressed the problem of preparing the public to respond to landslide
warnings.
This map of Southern California shows susceptibility to debris flows and other
shallow landslides. The landslide hazard is largely due to the state’s
unique weather patterns. Modified from D. Morton, 2003, USGS Open-File Report
03-17.
The 2005 La Conchita debris-flow tragedy is a painful reminder that a warning
system only addresses half of the problem. Once a warning is issued, how do
we encourage people to take action? U.S. residents are not in the habit of simply
dropping whatever they are doing and seeking refuge elsewhere, as evinced by
the recent hurricane disasters in the Gulf states. Despite warnings, many people
remain in dangerous situations out of inertia, denial or fear of abandoning
property. Anxiety is accompanied by a strong instinct to stay close to home
and loved ones, even if home itself is threatened. A warning received only on
an intellectual level may not be sufficient to override this basic instinct.
People have even been reluctant to evacuate in the face of an approaching wildfire,
but smoke and flames are powerful motivators. While a large fire is undeniable,
even from a distance, debris flows declare themselves only when they pounce.
Warning signs — small ground fissures, sudden gushes of muddy water —
are easily overlooked. Besides, mud seems so benign. Fire is a primal threat;
mud is merely a mess. Who runs from mud?
Further understanding of the landslide hazard will lead to better assessments
and better public awareness of the potential threat.
|
A
personal perspective from La Conchita I learned of the fatal Jan. 10 landslide from a local radio reporter, who was requesting a comment from me about “the deadly landslide in La Conchita.” At first, I thought that she meant the massive slump that occurred there in 1995, but that had not killed anybody. No, she said, this landslide happened today, in the past hour; hadn’t I heard about it? “No,” I replied, first puzzled, then with growing horror, “Oh … no!” I hadn’t heard; I was working on a press release, the latest in a series, warning of the risk of landslides from the heavy rains that had been soaking Southern California since a few days after Christmas. I downloaded a news photo of the new landslide from the Internet. The scar from the 1995 landslide was still clearly visible, looming over the houses of La Conchita. Smaller than the 1995 event, but more fluid, the 2005 landslide could move much faster and was, therefore, far more dangerous. Earlier in the day, I later learned, smaller debris flows had traveled down the hill and through the streets, all the way across the railroad and Highway 1. Residents anxiously watched the hillside, but did not evacuate. Ten people died, several of them children. The reporter asked the usual questions: “Why were these people still living there” (after 1995)? “Was there a landslide warning?” “Why hadn’t these people been evacuated?” I remember reciting the usual answers: Land-use policy is best addressed by local authorities. Public advisories had been issued by the U.S. Geological Survey and the National Weather Service, but these were regional, not specific to La Conchita. Meanwhile, staring at the news photo, I felt shock, like a physical blow, and profound sorrow. I couldn’t deny what I was seeing, but couldn’t fully assimilate it either. After watching, over many days of heavy rain, the landslide potential progress from possible to threatening, to horribly inevitable, how could I be so surprised? In the face of such human tragedy, the reporter’s questions — and my stock answers — began to seem weak and incomplete. I felt deeply disturbed by the La Conchita event; I still do. RW Back to top |
 |
Geotimes Home | AGI Home | Information Services | Geoscience Education | Public Policy | Programs | Publications | Careers |