geotimesheader
News
Notes
| Creeping
by the bay
New satellite-based technology enables seismologists to peek beneath
the surface and paint a picture of what makes the earthquake-clock tick.
Roland Burgmann of the University of California at Berkeley published work
in the Aug. 18 Science on aseismic creep along the Hayward fault
that illustrates a new way to look at crustal movements on a vertical,
rather than horizontal, scale. |
What is
this? |
Burgmanns preliminary findings were incorporated into the October 1999
USGS report that synthesized regional earthquake research and calculated
the probability that a major earthquake would occur on each major fault
segment and in the overall region.
In the USGS report, the Hayward fault estimates are based in part on
the idea of a cycle of strain buildup and release, says David Schwartz,
chair of the team that wrote the 1999 report. The last major earthquake
that originated on the Southern Hayward Fault broke in 1886. Prior to the
1906 San Francisco earthquake, the 1886, magnitude-6.8 earthquake on the
Southern Hayward fault was considered Californias big one. An
earthquake might have ruptured the Hayward fault in 1836 as well, Schwartz
says, but in the early 1990s it was discovered that the earthquake did
not originate on the Hayward fault.
In his reassessment of the Hayward Fault, Burgmann took advantage of
satellite-based radar techniques that are relatively new to the field of
seismology. Interferometric synthetic aperture radar (InSAR) techniques
have been employed by a few seismologists for only the past five years
to measure subtle vertical motions along the faults that result from locked
zones at depth, explains Bob Simpson of the USGS, who wrote a comment on
Burgmanns research for Science. Old geodetic and GPS measurements
only reveal horizontal movement of points. InSAR can measure vertical warping
on the scale of centimeters.
Burgmann was looking for answers to questions such as how deep the seismic
zone reaches and how its structure varies with depth. Burgmann used InSAR
to monitor the Northern Hayward Fault and used that information to model
the deepest parts of the seismic zone. You cant hide a locked patch,
he says. So to paint a picture of the interior of the fault zone, he first
modeled what would happen on a flat surface based on movements along planes,
or faults, in an elastic body using an elastic half-space model.
He then used the InSAR measurements of surface warp to run the model backwards
and image the subsurface structure, asking the question, How deep would
creep have to go to match the surface?
To best match surface observations with underground motion, Burgmann
estimates that the Northern Hayward fault experiences creep through most
of the seismic zone, down to 12 kilometers. There, at the base of the seismic
zone, lies the transition between brittle and ductile crust where major
earthquakes originate.
These findings, Burgmann says, push down the potential for that segment
to produce a very large earthquake on its own. He also says that the threat
of earthquake damage to the region is still very real. His findings show
that the likelihood that an earthquakes epicenter will lie along the Northern
Hayward is less because it does not have the locked regions that build
up strain. Locked sections to either side of an unlocked section still
provide a lot of energy for slip, says Jim Lienkaemper, a USGS seismologists
who also works in the Hayward fault region. The Southern Hayward and the
northern extension of the Hayward, the Rogers Creek fault, contain the
locked segments that, when released, could cause the next big one to
rip through the Northern Hayward as well. |
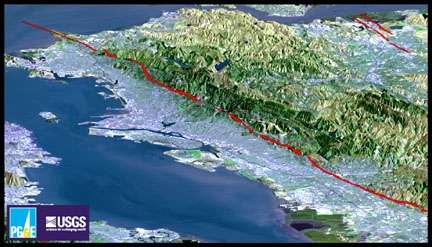
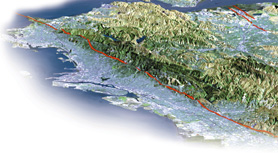
This map is a computer
generated view of the eastern part of the San Francisco Bay region,
looking north. The Hayward
Fault is shown in red, running just to the east of a highly urbanized
area. The image on the
top of the page was taken from this same USGS map. |
Creep attenuates the hazard from the surface, Schwartz says. But
regardless of how you cut it, the Hayward Fault is still a really high
hazard. The 1999 USGS report estimates a 32 percent chance that
a magnitude-6.7 or higher earthquake will unzip the Southern and Northern
Hayward and Rogers Creek fault system within the next 30 years. That estimate
is the highest for the faults surveyed in the San Francisco Bay area.
Not only can the unlocked segment rupture, the regional shaking caused
by the earthquake can cause significant damage miles from the point where
the break originated. Simpson cites the 1989 Loma Prieta earthquake as
an example. Its epicenter was 60 miles from San Francisco, yet the shaking
caused massive damages in the Bay area.
If an earthquake were to break on the Southern Hayward, the release
of strain would likely break through the Northern Hayward and into the
Rogers Creek fault, causing massive damage to the sprawling metropolitan
region. Dont unbolt your water heaters or cancel your earthquake insurance,
Simpson says.
Laura Wright
