
 Greenhouse gases
are on the rise — the data to support that trend have existed for years.
But scientists say now that a new method of tracking the effects of the gases
could lead to a more accurate understanding of their impact on climate change,
which other scientists say the Arctic is already experiencing on a dramatic
scale.
Greenhouse gases
are on the rise — the data to support that trend have existed for years.
But scientists say now that a new method of tracking the effects of the gases
could lead to a more accurate understanding of their impact on climate change,
which other scientists say the Arctic is already experiencing on a dramatic
scale.
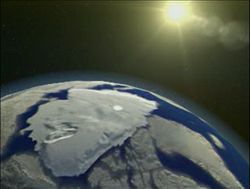
Warmer temperatures are melting away Arctic
ice. The temperature increase may be due to an energy imbalance posed by a rise
in greenhouse gases, in addition to less ice to reflect the sun's heat away
from Earth. Image courtesy of NASA.
Researchers at the National Oceanic and Atmospheric Administration (NOAA) developed
what they call a "scientifically unambiguous" index, that they say
will allow them to track changes in the gases that contribute the most to the
warming greenhouse effect. Their results, released on Sept. 27, show that these
increasing greenhouse gases are causing an imbalance between the solar energy
entering Earth's atmosphere and the energy going out, which can lead to warming
of the planet.
To create the Annual Greenhouse Gas Index (AGGI), NOAA scientists used measurements
of greenhouse gas concentrations, recorded around the world since 1979. They
accounted for only the main "long-lived" greenhouse gases that remain
in the atmosphere and are uniformly mixed throughout the global atmosphere;
those gases include carbon dioxide, methane, nitrous oxide and chlorofluorocarbons.
"In this way the index is similar to the Consumer Price Index, which includes
the most important commodities that reflect prices best," says David Hofmann,
director of the NOAA Global Monitoring Division of the Earth System Research
Laboratory in Boulder, Colorado, and a member of the research team that developed
the index.
The team converted the concentrations to a measure of how the gases change the
difference between the amount of solar radiation entering Earth's atmosphere
and the amount of energy leaving. The resulting index uses data from 1990 for
its baseline comparison, which is also the same year that the international
Kyoto Protocol uses to measure progress in the reduction of greenhouse gases.
A higher AGGI implies a greater change in Earth's energy budget. "The AGGI
will serve as a gauge of success or failure of future efforts to curb carbon
dioxide and other greenhouse gas increases in the atmosphere," Hofmann
says.
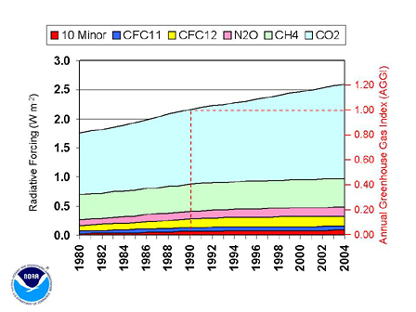
This chart shows that the change in the
difference between the amount of radiation entering Earth's atmosphere and radiation
leaving Earth, or "radiative forcing," is increasing over time, due
to rises in various greenhouse gases. Scientists are using data from 1990 as
a baseline for comparison.
According to the researchers, the 2004 index increased by 20 percent over 1990
values, mostly due to carbon dioxide. Hofmann says that interpreting the meaning
of this change "is beyond NOAA's mission."
There is nothing new about the data, which NOAA has been collecting for a long
time, says Tom Wigley, senior scientist at the National Center for Atmospheric
Research, Climate and Global Dynamics Division. But he says that the index provides
a new way to visualize the data and makes it accessable to everyone. When the
index is plotted on a chart, it helps people see that changing the energy balance
drives climate change, Wigley says. "It's like putting your foot on the
accelerator."
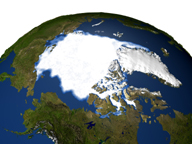
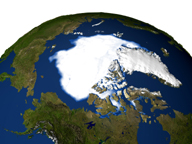
Mark Serreze, a senior research scientist at the National Snow and Ice Data
Center (NSIDC) at the University of Colorado, Boulder, says that the increased
greenhouse gas concentrations have spurred higher temperatures and acted as
a kicker to the Arctic warming trend, which has led to a significant melting
of the ice. The NSIDC reported on Sept. 28 that the extent of Arctic sea ice
dropped Sept. 21 to a little over 5 million square kilometers, which is the
lowest area measured since NASA satellites started taking data in 1978. From
the data, scientists estimated that the Arctic loses ice at a rate of about
8.5 percent per decade.
 Serreze
says, however, that greenhouse gasses are not the only reason for the declining
ice. Patterns of natural variability such as the North Atlantic Oscillation
— a cyclical climatic occurrence that alters weather patterns in the North
Atlantic Ocean — as well as increased levels of cloud cover, are also contributing
factors. "We're starting to see the effects of greenhouse gases,"
Serreze says. "But even if greenhouse gases are removed, you will always
see variability."
Serreze
says, however, that greenhouse gasses are not the only reason for the declining
ice. Patterns of natural variability such as the North Atlantic Oscillation
— a cyclical climatic occurrence that alters weather patterns in the North
Atlantic Ocean — as well as increased levels of cloud cover, are also contributing
factors. "We're starting to see the effects of greenhouse gases,"
Serreze says. "But even if greenhouse gases are removed, you will always
see variability."
Kathryn Hansen
Links:
NOAA
Earth System Research Laboratory
National
Snow and Ice Data Center
NASA
news release with Arctic ice animation
 |
Geotimes Home | AGI Home | Information Services | Geoscience Education | Public Policy | Programs | Publications | Careers |