 On
a warm summer afternoon, Tom Coffin took a stroll across the martian landscape.
Boulders and small rocks poked out of the red-dirt surface, seemingly close
enough to touch.
On
a warm summer afternoon, Tom Coffin took a stroll across the martian landscape.
Boulders and small rocks poked out of the red-dirt surface, seemingly close
enough to touch.
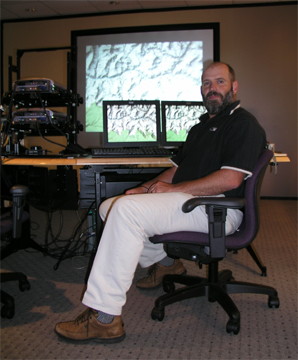
Tom Coffin sits in front of a GeoWall projecting a topographic map of the Grand
Canyon in 3-D, at the NCSA offices in Arlington, Va. Photo by Naomi Lubick.
But the view was only virtual. Coffin, a program manager based in the Arlington,
Va., offices of the National Center for Supercomputing Applications (NCSA),
was demonstrating a 3-D viewing tool in a computer lab across the street from
the National Science Foundation (NSF). Coffin’s shadow blocked out the
landscape as soon as he stepped in front of the projector beaming a pair of
color images, taken slightly offset from each other by two cameras on the rover
Opportunity, just after it landed on Mars. Not long after NASA scientists downloaded
the images, Coffin and Paul Morin of the University of Minnesota, Minneapolis,
had transformed it for viewing using the application, called GeoWall.
The teaching tool allows its users to “plug in” landscapes, topography
or other spatial data, and then project it on a wall for viewing in 3-D. Looking
at the Mars landscape at almost life-size, with merely a pair of polarized spectacles,
is an attractive alternative to the more traditional 3-D setup: Using a set
of photographs that are slightly offset, known as stereograph images, and either
trying to cross one’s eyes just enough to make the landscape resolve into
3-D, or using old-fashioned stereographic viewers, perched over a table surface.
Now, instead of headache-inducing eyeball gymnastics, GeoWall projectors allow
teachers to throw a 3-D stereograph image up on the wall to be viewed with relative
ease by large groups of people at once.
Unveiled in 2001, GeoWall can now be found in college classrooms, labs and science
museums across the country. The program has become a more attractive teaching
tool as computers and projection equipment get cheaper. Costs include a Windows
or Linux-based computer with the correct graphics and sound cards, and a projector.
Also necessary are screens that can properly maintain polarized viewing, which
can cost anywhere from $300 to $1,500 and more, depending on their quality.
Some screens allow for projection from behind, which removes the issue of walking
in front of the projector’s lightbeam.
A fully working GeoWall with varying components of different sizes and configurations
can cost as little as a few thousand dollars and as much as $15,000. One configuration
is a GeoWall-in-a-Box that packs down to the size of a standard suitcase, a
little more than the weight of a computer and its component parts.
Morin says that he has lost track of how many people are using the visualization
tool. But the online GeoWall Consortium shows that screens have popped up everywhere
from the geology department at Indiana University, Bloomington, to Lincoln Elementary
School in Oak Park, Ill., to the earth sciences department at Cardiff University
in England. Morin’s colleague Karen Campbell of the National Center for
Earth-surface Dynamics has worked to bring such walk-in landscape views to science
museum displays, as well as to other users, such as engineers and sociologists,
through NSF.
Techniques for 3-D visualization may be more common in professional settings,
such as for geophysics groups working for petroleum companies, but GeoWall remains
a less expensive and therefore more readily accessible tool to educators and
others, its developers say. “We find it extremely beneficial at the introductory
level,” and “useful to show more complex phenomena” such as seismic
reflections through Earth, says Peter van Keken of the University of Michigan,
Ann Arbor, who helped develop the product, in conjunction with computer specialists
at the University of Illinois Urbana-Champaign. “Many geologists are by
training often good at understanding spatial relationships and don’t necessarily
need the 3-D capabilities of the GeoWall.”
In addition to beginning geologists, other kinds of data users may find it useful.
For example, a radiologist may be able to use such viewing tools to travel through
the body, to check positioning of organs or other targets.
Kent Kirkby, who teaches geology at the University of Minnesota in Minneapolis,
says that 10 to 15 percent of students using stereographic maps score higher
on basic map understanding tests than those using regular topographic maps.
“For earth science, the greatest barrier is often map interpretation,”
Kirkby says. “In the past, students who did not enter the class with strong
spatial skills tended to do poorly. Now, GeoWall can level the playing field.”
Morin, Kirkby and co-workers developed ways to translate paper topographic maps
into slightly offset image pairs for GeoWall projection, to make them pop up
in 3-D. The difference between a flat topographic map of the Grand Canyon, for
example, and the GeoWall projection of its steep walls in the 3-D composite
is stark. Showing a map or image in “stereo makes an incredible difference
in teaching,” Kirkby says, changing classroom dynamics and allowing teachers
to teach concepts instead of how to read topo-lines. These advantages are useful
when engaging students who are not geology majors, Kirkby and others say. And
even though “GeoWall doesn’t replace reality,” Kirkby says, the
application does allow him to take 800-plus undergraduate students on “a
15-minute photo odyssey” of the Iron Ranges or Lake Superior’s North
Shore, without the half-day drive to go there.
GeoWall “helps to offset the drawbacks of traditional teaching,” van
Keken says. The visualizations would be useful “any time you see a TA or
professor start using his hands and a piece of paper, bending it.” Plus,
the packages can be small enough to ship to Michigan’s permanent field
camp in Wyoming every year, for evening review of structures and other concepts
seen in the field that day.
Franek Hasiuk, who took a geophysics course with van Keken, says that “the
best visualization I remember was one of world earthquakes,” which plotted
each event in space, showing its depth and position compared to the others.
Hasiuk says that he could “‘watch’ a subducting slab” and
compare it to other slabs “just by seeing where the earthquakes plot”
spatially. The program also allows viewers to “steer” through the
3-D imagery of the subduction zone, as the images “can be zoomed, rotated
and skewed in any way desired to highlight particular aspects of the map,”
Hasiuk says. People can view topographic maps in GeoWall in the same way, allowing
the “mouse driver” to swoop into the Grand Canyon, for example.
Morin also notes that there is room for improvement. “Our brains are basically
wired” for 3-D, he says, something GeoWall’s creators “want to
make intuitive.” A screen has at most 2 million pixels; a map probably
has 50 million pixels. “That means you are throwing away 90 percent”
of the data from a 2-D map, and with it, a lot of the details that may be important
geologically. The next incarnation, GeoWall2, may help make up for that loss,
as will the use of multipanel displays and other hardware improvements.
Naomi Lubick
Links:
Geowall
consortium
National
Center for Earth-surface Dynamics
Back to top
 |
Geotimes Home | AGI Home | Information Services | Geoscience Education | Public Policy | Programs | Publications | Careers |