
 In the past few years, residents of
Tuvalu, a nation of more than 10,000 people living on South Pacific island atolls,
have begun to consider moving their families away. As sea level rises, it threatens
to flood the low-lying islands that make up the 10-square-mile country, none
of which are higher than 4.5 meters (15 feet) above the ocean.
In the past few years, residents of
Tuvalu, a nation of more than 10,000 people living on South Pacific island atolls,
have begun to consider moving their families away. As sea level rises, it threatens
to flood the low-lying islands that make up the 10-square-mile country, none
of which are higher than 4.5 meters (15 feet) above the ocean.
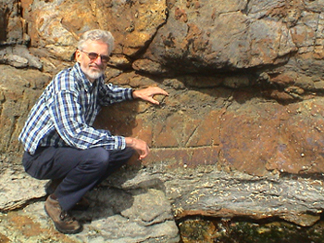
John Hunter of the Antarctic Climate & Ecosystems Cooperative Research Centre
at the University of Tasmania perches next to a historic tidal benchmark on
the Isle of the Dead (Port Arthur, Tasmania), one of many used to track sea-level
changes. Photo by Donna Roberts, Antarctic Climate & Ecosystems Cooperative
Research Centre.
While Tuvalu may seem to be the extreme example, changing sea levels, potentially
enhanced by global warming, threaten coastlines around the world. Estimates
of past and current sea-level changes, however, remain uncertain and controversial.
The uncertainty has been incorporated into policy discussions, including the
2001 Intergovernmental Panel on Climate Change (IPCC) report, which gives a
range of 1 to 2 millimeters of annual sea-level rise with large error bars.
Now, a team of researchers from Australia and Canada says its recalculation
is the most thorough yet, confirming higher estimates of sea-level rise. Scientists,
however, continue to debate the causes of the changes.
Using global altimeter measurements taken by the TOPEX/Poseidon satellite over
the past decade, John Church of CSIRO and his co-workers matched those data
to historic tide-gage measurements around the world. From behavior recorded
by satellite, they could extrapolate the behavior of sea level in regions where
tide gages were sparse, extending the sea-level changes statistically over the
past half-century, from 1950 to 2000. Church’s team ran their reconstruction
multiple times to test the reliability of the tide gages and their changing
geographic distributions.
Over that half-century, they report in the July 1 Journal of Climate,
sea level has been rising by 1.8 millimeters a year, plus or minus 0.3 millimeters.
One key finding is that sea-level rise varies regionally across the planet.
The eastern Pacific has tongues of water north and south of the equator rising
at a maximum rate of 3 millimeters a year (Tuvalu sits toward the edge of the
southern tongue), while a central equatorial band in the Pacific has only seen
a 1.5-millimeter annual increase in sea level. The eastern Indian Ocean also
is rising at only 1.5 millimeters a year, but the northeastern Indian Ocean
has a maximum sea-level rise of 2.5 millimeters a year.
Walter Munk of the Scripps Institution of Oceanography calls the work “a
very good summary of where we stand.” But, he says, “the paper says
nothing about the cause of the rise, nor does it pretend to.”
Munk and Peter Wadhams of the University of Cambridge recently reassessed the
components of sea-level rise. Traditionally, most scientists have accepted that
sea level is rising because of warming oceans, which expand, and also from other
inputs of water, including melting glaciers and more precipitation. But the
introduction of fresh water into the oceans from melting sea ice, largely ignored
in past research, may also be important in assessing sea-level rise measurements,
Munk and Wadhams suggest in the June 12 Geophysical Research Letters.
Quantifying each of these components is difficult, and using current estimates
provides a lower value for sea-level rise than Church’s team’s number,
at around 1 millimeter a year, Wadhams and Munk calculate. “Satellites
and tide gages do suggest that the actual rates are higher,” Wadhams says,
which means that something is wrong with the water source census. “We need
to find 1.3 millimeters per year from melting ice sheets,” Munk says.
But the controversy comes with trying to determine why the sum of sea-level
rise is greater than its parts. “You’ve got to really struggle to
explain that” high rate of observed sea-level increase, says Philip Woodworth
of the Proudman Oceanographic Laboratory in Liverpool.
Woodworth, who has co-authored past assessments of sea-level rise, including
with Church and others for the 2001 IPCC report, suggests that although “passing
the buck” to melting glaciers works to some extent, the bigger unknowns
come from continental contributions of freshwater. These have remained difficult
to pin down.
Church also says there is “still some missing component”; he suspects
it may be an underestimate of ocean expansion from warming, something he is
trying to calculate as rigorously as his team did for sea-level changes. As
for consensus on whether his group’s new sea-level rise numbers are right,
he says, “we’ll have to wait and see.”
The new numbers indicate that Tuvalu lost a mere 20 centimeters of height over
a century — but with the rate of sea-level rise projected to increase in
the next century, its low-lying atolls stand to lose a good deal of area. Other
coastal nations, such as Bangladesh, will also continue to see sea levels slowly
rise and threaten their communities.
Naomi Lubick
Back to top
 |
Geotimes Home | AGI Home | Information Services | Geoscience Education | Public Policy | Programs | Publications | Careers |