
|
NEWS NOTES | September 1999 |
From shrubs to sand
Asteroid family trees
Geologic mapping takes congressional stage
New USGS lab offers 'world-class' analysis
Karst modeling and 'desktop geology'
Spain gets first approved meteorite in 50 years
The Northern Hemisphere was warmer around 9,000 years ago than it is
today, and its forests extended beyond the modern tree line. In addition,
it received more summer sunlight, which amplified the African summer monsoon,
because of Earths tilt and orbit. North Africa, covered by vegetation,
had a wetter climate than its does today.
| Previous studies assign various dates to North Africas
transition to the Sahara and suggest different degrees to which humans
affected this change. Some research suggests that the Saharas desertification
occurred in two steps with two dry periods one 6,700 to 5,500 years ago
and one 4,000 to 3,600 years ago. The latter phase was severe, damaging
civilizations. Other reconstructions indicate that approximately 4,800
years ago marked a decline in Saharan civilizations, caused by severe desertification.
Other evidence, however, suggests that settlements survived to 3,850 years
ago by utilizing nonrenewable groundwater resources. The disappearance
of freshwater lakes 5,700 to 4,000 years ago marked the end of abundant
rainfall, while reconstructions from pollen sequences indicate a strong
increase in temperature and decrease in rainfall around 6,000 years ago.
Claussen and others report that the Saharas desertification was abrupt and began 5,440 years ago (±30 years), according to 10 simulations from CLIMBER-2, a climate model named for the climate and the biosphere. Within the model, all conditions including distribution of inland ice and atmospheric CO2 concentrations were constant, except for changes in Earths orbit and tilt that controlled the amount of sun exposure. The simulations indicate a slight decrease in global near-surface temperatures of 0.1 K in 3,000 years until approximately 5,800 years ago, when a sharper decrease of 0.2 K in 300 years appeared. A similar event followed about 1,000 years later, according to the model. |
Sand encroaching on natural vegetation around a rare spring in southwestern Egypt, the driest region of the Sahara of North Africa. Photo from Farouk el Baz, Boston University. |
These cooling events occurred in high latitudes over the North Atlantic, but the greatest reductions happened in the Saharan region. About 5,600 years ago in the Sahara, precipitation decreased strongly, grassland decreased, and the fraction of vegetation cover started to decrease abruptly over 300 years, according to the model.
Both cooling events are unusually abrupt for the relatively smooth changes in Earths orbit and tilt, the scientists write. The researchers tested the dynamics of an atmosphere-only model, an atmosphere-vegetation model, and an atmosphere-ocean model in various combinations to understand the suddenness of the change. By modeling the impact of climate, oceans, and vegetation, the scientists concluded that the ocean played a minor role in the atmosphere-vegetation feedbacks.
They conclude that the change in Earths orbit and tilt initiated the desertification. Earths tilt was 24.14 degrees 9,000 years ago, in contrast to its modern tilt of 23.45 degrees. The perihelion, the point in Earths orbit that is closest to the sun, occurred in July instead of in January as it does now.
These subtle changes caused decreases in precipitation and temperatures
from 9,000 to 6,000 years ago to the present, the scientists write. But,
they add, the Saharas abrupt desertification resulted primarily from regional
changes in vegetation and from atmospheric changes in the climate system.
A global interplay between the atmosphere, ocean, sea ice, and vegetation
determined when desertification occurred. More research is necessary, however,
to determine precise effects on the timing of the desertification of low
vs. high latitudes and of oceanic responses in comparison to biospheric
feedbacks.
They also conclude that the Saharas transformation was a natural phenomenon,
and land-use practices such as cultivation and use of nonrenewable resources
by people living in the Sahara was negligible. The desertification, however,
may have been an important reason for the foundation of civilizations along
the Nile, Euphrates, and Tigris Rivers.
Julia Cole
Geotimes Intern
Schelte J. Bus, who recently earned his Ph.D. from the Massachusetts Institute of Technology (MIT), reviewed current research on asteroid spectroscopy during the International Conference on Asteroids, Comets, and Meteors held July 2630 at Cornell University.
Recent work on asteroid families springs from research started decades ago, showing that a significant fraction of the main-belt asteroids appeared to cluster together into groups that werent random but were based on their orbital patterns. While it is believed that these groupings of asteroids arise from the past collisional breakup of once larger parent bodies, the study of asteroid orbits alone cannot prove this collisional hypothesis, Bus says.
Most of the last decades data about asteroid compositions have come from Earth-bound spectroscopic studies. Such studies have revealed much more about the compositions of the asteroids in the orbital families. Spectroscopic studies have helped researchers place constraints on the compositions of the asteroids, thus providing clues about each asteroids petrology and thermal evolution.
Asteroid diameters range from the width of a pebble to about 1,000 kilometers. Collisions between asteroids could break the larger asteroids into smaller fragments. If the asteroids in one family resulted from the breakup of a single, larger asteroid, Bus says, the pieces should make genetic sense the bodies should appear to come from one parent.
Bus studied the different compositions of asteroids within single, smaller families (as defined by orbital statistics) in the main belt as part of the Small Main-belt Asteroid Spectroscopic Survey (SMASSII), using the Michigan-Dartmouth-MIT Observatory on Kitt Peak in Arizona. He also worked with his advisor, Richard P. Binzel, and other colleagues to study the compositions of asteroids orbiting within the Vesta asteroid family. The technology of CCD (charge-coupled device) spectroscopy allows them to investigate the spectra of very small asteroids, which reflect a relatively small amount of sunlight to Earth.
CCD spectroscopy has opened up a whole new avenue, Bus says. The spectroscopy is the best indicator we have from remote sensing of the surface compositions and, therefore, of the bulk composition of asteroids.
Both investigations, two of many ongoing spectroscopic studies of asteroids, show that the families defined by orbital patterns closely match families grouped by spectral properties. Recent missions bringing spacecraft close to larger asteroids such as Gaspra, Mathilde, Ida, and Eros, revealed craters on the asteroids, hinting that collisions are common for them. But the spectroscopic work is providing clues about the higher-energy collisions that have completely shattered larger asteroids, Bus says. In the study of these collisional families, we have the unique opportunity to examine the interiors of once larger planetary bodies, he says.
He adds that the asteroid families studied so far showed strong spectral similarities among individual members. Not much evidence shows that we are sampling different units of a differentiated parent body within any one family, he says. For example, fragments of an iron-rich core, olivine-rich mantle, and silicate crust have not been observed in a single family. Each family appears to be quasihomogeneous, Bus says.
Theres no doubt that, long ago, there had to be asteroid families that were differentiated. We see evidence of this among the meteorite collections. Where are the families that are associated with those differentiated parts?
Kristina Bartlett
Geotimes magazine
Policy-makers first focused attention on geologic mapping issues largely through the efforts of the Association of American State Geologists (AASG). The AASG conducted a study in the late 1980s concluding that only 18 percent of the 1:24,000-scale map quadrangles covering the United States had been mapped with sufficient detail for use in resource development, environmental protection, and natural hazard identification and mitigation. In 1988, to correct this shortcoming, AASG and the USGS took the first steps in developing a geologic mapping program. These steps eventually led to passage of the National Geologic Mapping Act (NGMA) on May 18, 1992. The NGMA established a USGS-based national cooperative geologic mapping program with four components: two federal components, FedMap and SupportMap, authorizing funds for federal mapping priorities and interdisciplinary support through paleontologic, geochronologic, geochemical, and geophysical studies; StateMap, authorizing federal funds to match state funds for state mapping priorities; and EdMap, authorizing federal funds to match university money spent training future mappers.
In 1997, the original NGMA was amended and reauthorized through fiscal year (FY) 2000. That bill runs out this year, paving the way for the next iteration: the National Geologic Mapping Reauthorization Act of 1999. Two identical companion bills with that title, S. 607 and H.R. 1528, have been introduced in the Senate and House respectively and are working their way through the legislative process. The Senate Subcommittee on Forests and Public Land Management voted unanimously in favor of the bill earlier this year. The House held a June 17 hearing before the House Resources Subcommittee on Energy and Mineral Resources on H.R. 1528, sponsored by subcommittee chairwoman Rep. Barbara Cubin (R-Wyo.).
Rep. Jim Gibbons (R-Nev.), sitting in for an under-the-weather Cubin, chaired the June 17 hearing. Gibbons is a former mining geologist and graduate of the University of Nevadas Mackay School of Mines. Witnesses included USGS Chief Geologist P. Patrick Leahy, who spoke about FedMap; West Virginia State Geologist and Association of American State Geologists President Larry Woodfork, who detailed the StateMap program; and University of Kentucky geoscience professor William A. Thomas, representing the American Geological Institute, who outlined his involvement with EdMap. All three witnesses expressed their support for the bill and for the partnerships it represents between federal and state governments and the academic community.
The reauthorization bill retains the basic structure of cooperation
between federal and state agencies and universities, as does the original
act, but differs from the original legislation in a number of ways. The
principal changes in this reauthorization bill are: First, an increase
from approximately 20 percent to 48 percent of new funds will be made available
for matching-funds grants to state geological surveys; and second, an increase
in the authorization levels, Leahy said during the hearing.
This increase in funding available to states would greatly expand the
federal-state partnership. The new bill authorizes funds through
FY 2005 and calls for more than a doubling of funding by that time to a
level of $64 million, up substantially from the current FY 2000 authorization
of $30 million. John Pallister, coordinator of the USGS National Cooperative
Geologic Mapping Program, attributes this growth to a recognition of a
healthy economy and a healthy relationship between the USGS and the state
surveys.
A week after the hearing, the full House Committee on Resources voted unanimously in favor of H.R. 1528, which waited for action on the House floor in July. As in previous years, geologic mapping legislation enjoys broad, bipartisan support; but such support by no means guarantees passage. The last reauthorization effort was delayed for a year after falling victim to unrelated, parliamentary maneuvering. A reauthorization bill passed the House in 1996, but a succession of senators threatened to filibuster all bills coming from the Senate Energy and Natural Resources Committee in an effort to force action on their own bills. As a consequence, bills under that committees jurisdiction the geologic mapping bill among them died when the session ended. The legislation was resurrected in 1997 at the start of the 105th Congress, passed both houses, and was signed by the president on Aug. 5, 1997.
Bill supporters recognize, however, that even if this legislation becomes law, the funding increases are by no means guaranteed. As with any authorization, the actual dollars are distributed through the annual appropriations process. Will Congress and the administration live up to the levels set forth in H.R. 1528 and S. 607? We call that the $64-million question, Pallister says. The act has been around for several years now and has not yet fulfilled its promise. The intention of the new bill and the increased authorization levels is to have the NGMA live up to that promise. In FY 1999, the program received about $22.5 million, well below the $28 million authorized, and closer to the level it has retained since 1992. Proponents hope that passage of the new bill will send a strong message of support to both the administration and members of the appropriations committees, making expanded geologic mapping efforts possible in coming years.
Scott Broadwell
1999 AGI/AIPG
Geoscience Policy Intern
Visit the American Geological Institute's
Government Affairs Program Web site for an update
on the reauthorization.
As we grow as a nation, water is a more important issue, says Linda Pratt, chief of the labs inorganic chemistry program. As more people recognize water as a scarce resource, she says, the level of this awareness increases. There is a growing interest in the impact that organic chemicals have on the environment, she says. Pesticide metabolites, for example, are organic products chemically changed by heat, air, and sunlight that scientists are looking at more closely. The NWQL is one of the few labs with the analytical capability to test routinely for pesticide metabolites, says Mark Burkhardt, chief of the labs organic chemistry program.
USGS offices and affiliates send the NWQL about 30,000 samples every
year for chemical analysis. The NWQL analyzes these samples for federally
funded programs, such as the National Water Quality Assessment Program,
and for projects between the USGS and other federal, state, and local agencies.
Testing for a variety of organic and inorganic constituents, scientists
at the NWQL analyze groundwater, surface water, fluvial sediment, plant
and animal material (biologists identify and count the invertebrates),
and precipitation samples. The NWQL also develops new methods and procedures
for improving water-quality analysis.
U.S. Geological Survey National Water Quality Laboratory at the Denver Federal Center. Photo by Jon Raese, USGS. |
Several years ago, Pratt says, the federal government wanted
to move the lab, which had been about 10 miles away in a Denver suburb,
to a new facility at the Denver Federal Center. The old building did not
meet the labs growing needs, Burkhardt adds. We outgrew the other facility.
This building is a more modern facility [that allows us to] adapt in the
future, he says. The new facility is a larger building that, unlike the
previous building, is customized for laboratory use and has room for expansion.
Its design also allows an efficient material and work flow. We want to
configure the lab so we can minimize cost while, at the same time, keep
quality high, he says.
The lab houses more than $10 million worth of analytical equipment.
The new building has space for additional equipment, so NWQL purchased
new instruments that improved the labs ability to detect low levels of
trace metals and organic compounds.
|
For example, the lab has five new liquid chromatograph-mass spectrometers that detect pesticide metabolites, one new inductively coupled plasma-mass spectrometer (ICP-MS), and upgrades adding new low-level detection systems to two other such spectrometers. Testing for low-level concentrations is important because the lower you go, the more scientifically accurate a statement you can make, Burkhardt says. An ICP-MS measures trace metals in water or tissue samples. According to Burkhardt, an ICP-MS tests for 26 metals in four to six minutes. This instrument allows us to look for a greater number of metals in a shorter amount of time, he says.
NWQL also tests for presently unknown contaminates that scientists think are environmentally relevant. For example, NWQL researchers discovered the presence of MTBE (methyl tertiary butyl ether), an oxygenated fuel additive, in runoff water and groundwater samples. Emerging contaminates is an area of science that we are always working on, Pratt says. NWQL scientists are currently looking for pharmaceuticals in water samples, Burkhardt says. They are researching the amounts and effects of pharmaceuticals such as antibiotics, stimulants, and depressants that contaminate water.
Julia Cole
Geotimes Intern
Karst modeling and 'desktop geology'
Groundwater, being quantified by well-established equations for laminar flow and mass balance, lends itself readily to numerical modeling. Karst aquifers are a dramatic exception because of the presence of turbulent flow through solution conduits. Programmers have no difficulty incorporating pipe-flow into numerical models, but if the location of the pipes is unknown, as it usually is, there is no hope of devising a predictive flow model in such aquifers. In fact, one begins to question whether numerical modeling can cope with the uncertainties inherent in any bedrock aquifer.
A symposium on karst modeling held in Charlottesville, Va., Feb. 2427, 1999, and sponsored by the Karst Waters Institute of Charles Town, W.Va., featured the leading karst modelers from North America and Europe, together with most American karst field researchers.
During the symposium it became clear that no single modeling technique can adequately characterize karst aquifers, and that we must rely instead on a synthesis of conceptual, analytical, numerical, and statistical techniques. Although numerical models have captured the scientific high ground, it was readily acknowledged that they are unsuited to quantitative prediction of groundwater flow and contaminant dispersion in real karst aquifers. They are instead best used for evaluating idealized conditions, in particular the geomorphic evolution of solution conduits. Such models have gone a long way toward explaining the nature and distribution of karst porosity.
Representatives from several European universities revealed geomorphic models based on recent advances in carbonate dissolution kinetics. Malcome Field of the Environmental Protection Agency (EPA) Superfund branch in Washington, D.C., demonstrated EPA software for interpreting quantitative dye traces. The modeling team from the University of Waterloo (Ontario) described their latest software dealing with contaminant dispersion in fractured media. Using a succession of models of increasing refinement, they demonstrated that errors in discretization (dividing a continuous model into discrete segments) result from choosing too coarse a finite-element or finite-difference grid and can produce answers that are not simply approximate, but entirely wrong.
Any kind of model must be grounded on solid field evidence, a rare commodity in the growing trend toward desktop geology. Thus a powerful first step in karst studies is to develop a valid conceptual model one that applies hydrologic and chemical concepts to the local geologic setting. Threaded throughout the symposium were presentations that clearly demonstrated the hazards posed by groundwater studies divorced from the conceptual geologic framework. In case histories, dye tracers showed that travel times estimated for karst groundwater on the basis of traditional well tests and linear flow equations were overestimated by two orders of magnitude.
Symposium attendees even put dye tracing, the karst hydrologists ace-up-the-sleeve,
under close scrutiny. Recent data on dye stability, spectrometry, multiple
dye breakthrough curves, and the nature of background fluorescence have
strengthened the scientific basis for tracer studies. But they also confirm
that tracer studies can be unreliable in inexperienced hands.
The uncertainty of predicting conditions within karst aquifers has
encouraged the development of statistical models. Applying fractals and
probability to the distribution of karst porosity shows promise for facilitating
exploratory and management decisions. Instead of giving clients the yes-no
answers they normally expect from environmental studies, karst modelers
should deliver scientifically valid answers, ideally stated in terms of
probability and confidence levels. Field data are rarely sufficient to
provide a statistically valid database, but such a database is a desirable
and attainable goal.
As programmers become more skilled at simulating the natural world,
the distinction between physical and virtual reality becomes blurred. The
greatest challenge is to determine the true nature of what is being modeled.
Of any geologic setting, karst poses the most serious problems of modeling
water supply, water quality, land stability, and prediction of mineral
resources. The difficulties of modeling these phenomena are all too apparent.
The convergent nature of the approaches offered by the symposium participants
despite their diversity, shows promise for a coherent strategy in addressing
these problems in the future.
The karst modeling symposium was made possible by grants from the National
Science Foundation, the Army Research Office (Corps of Engineers Waterways
Experiment Station), the Donors of the Petroleum Research Fund of the American
Chemical Society, and the Cave Conservancy of the Virginias. A summary
of the entire symposium is available from Elizabeth L. White, E-mail: wbw2@psu.edu.
Arthur N. Palmer
Department of Earth Sciences, State University of New York, Oneonta,
N. Y.
| Valencia is a chondrite (silicate-rich stony meteorite)
and forms part of the rock collection of the Department of Geology of the
University of Valencia, Spain. The Meteorite Nomenclature Committee of
the Meteoritical Society has recently approved Valencia as a meteorite.
Despite being the only meteorite from Spain authenticated in the last 50
years, the historical documents that could have shed light on the exact
location and date of its fall were destroyed by a fire that razed most
of the University of Valencia in 1932.
The study of Valencia has led to the recovery of a unique specimen that had been gathering dust in the collection of a small university. The meteorites international approval has also renewed interest in meteorite research in Spain. This newly found, unique piece of scientific and geological heritage can currently be seen in the museum of the Department of Geology at the University of Valencia. To date, there have been 35 meteorite falls registered in Spain, of which about 60 percent correspond to well-catalogued samples. References do exist regarding falls on Spains east coast: Oliva-Gandía in 1520, Valencia in 1603, and Peñíscola in 1916. Unfortunately, no specimens are known to exist. Thus, the meteorite Valencia cannot be clearly assigned to a specific event. |
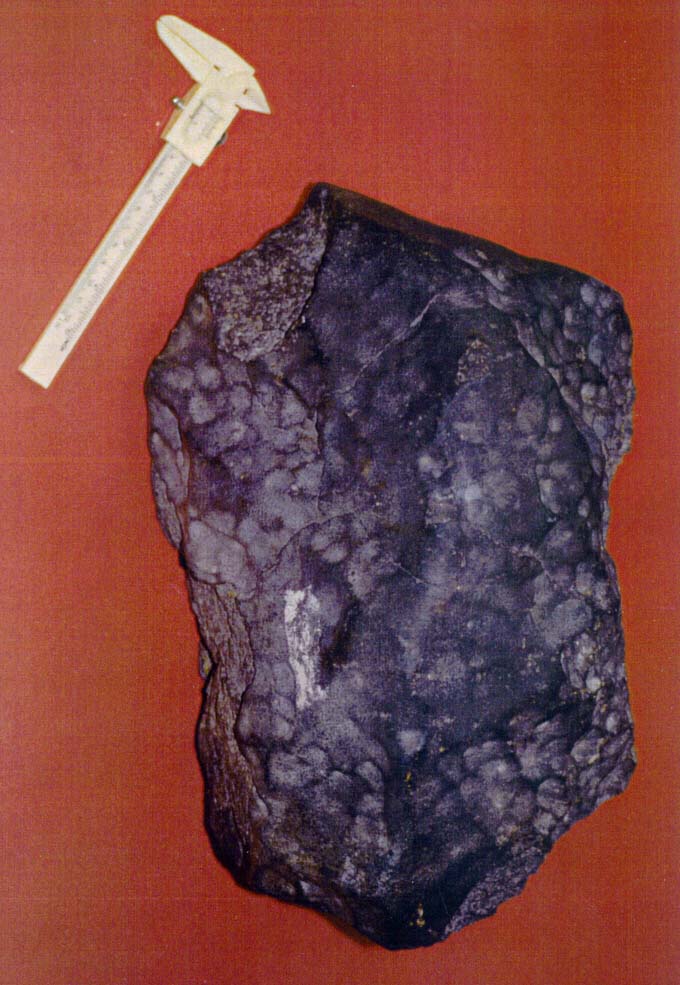
Valencia meteorite (Department of Geology, University of Valencia, Spain). Note the numerous imprints of atmospheric flight (regmaglypts). |
Valencia is a parallelepiped-shaped specimen measuring 37 by 24.5 by 19.5 centimeters, weighing 33.5 kilograms, and having an average density of 3.7 grams per cubic centimeter. Externally, it displays a 1-millimeter-thick, dark-fusion crust and numerous imprints of atmospheric flight (regmaglypts and friction striae).
Transmitted and reflected light microscopy and X-ray diffraction studies, as well as electron microprobe analyses, indicate that Valencia is composed of silicates (forsterite, clinoenstatite, and minor albite), iron-nickel alloys (kamacite, taenite), sulphides (troilite), oxides (periclase, hercynite) and sulphates (yavapaiite).
Geochemically, Valencia matches the ordinary H5-type chondrite.
Estimated exposition ages for Valencia, based on isotopes of helium, neon, and argon, indicate an average exposition age of 6.9 Ma, with a possible loss of helium. Ages of gas retention, based on isotopes of helium and argon, suggest that the loss of helium was greater than that of argon. Researchers are still investigating whether this loss was conditioned by a subsequent impact, after the individualization impact of Valencia from the parent body, or resulted from other processes.
J. Muñoz Sanz and J. Martinez-Frias, Departamento de
Geología, Museo Nacional de Ciencias Naturales, Madrid, Spain
B. Lavielle and E. Gilabert, Centre dEtudes Nucleaires de
Bordeaux-Gradignan, Universite de Bordeaux, France
 |
Geotimes Home | AGI Home | Information Services | Geoscience Education | Public Policy | Programs | Publications | Careers |