
Outside my window, streaky clouds veil a cornflower blue sky. Beneath that
layer of haze, a cloud that looks strikingly like a goldfish is swimming past.
The sun is shining through, only slightly muted. The goldfish cloud is gone
in a few minutes.
Although it looks sunny and warm, I know from the Weather Channel that it’s
cold outside — 39 degrees Fahrenheit and it feels like 30 degrees from
the winds that blew away the goldfish. Still, chances are good that it’s
going to be a beautiful weekend, around 45 degrees Fahrenheit with some clouds
and lots of sun. The meteorologists can even tell me that next week, there’s
a 30 percent chance it’s going to rain on Monday.
But the forecast for the weather outside my window on a February afternoon 50
years from now or 100 years from now is much more uncertain. While meteorologists
have gotten dramatically better at predicting the week’s weather over the
past few decades, predicting long-term climate changes with certainty is currently
impossible.
That has not stopped climate scientists from trying. They first created general
circulation models, also known as global climate models or GCMs, in the 1960s
and 1970s, based on weather prediction models. As the name suggests, the models
can only give generalized global average temperature changes for Earth.
The wide range of results for varying climate scenarios indicates that global
average surface temperatures will rise several degrees Celsius over the next
century or so. While the basic principles behind the models have not changed
in the past few decades, the scientific understanding and the technological
horsepower behind them have improved. Still, the models’ inherent uncertainties
have continued to cause debate among scientists and policy-makers about the
best course of action to take.
Building a model
 Describing
Earth’s complex climate system requires complex models, made of computer
algorithms that generalize physical characteristics at a scale that covers the
entire globe in patches, a few hundred square kilometers apiece. Many of the
characteristics the algorithms describe are things a meteorologist might take
into account: wind direction, ambient temperature, past behaviors for global
and regional weather, ocean currents, clouds and a slew of other aspects.
Describing
Earth’s complex climate system requires complex models, made of computer
algorithms that generalize physical characteristics at a scale that covers the
entire globe in patches, a few hundred square kilometers apiece. Many of the
characteristics the algorithms describe are things a meteorologist might take
into account: wind direction, ambient temperature, past behaviors for global
and regional weather, ocean currents, clouds and a slew of other aspects.
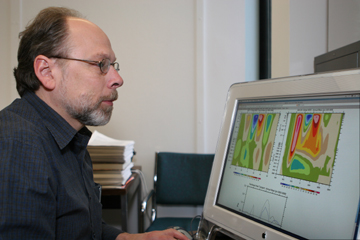
Jeff Kiehl, a senior scientist in NCAR’s
Climate Change Research section, examines changes in ocean circulation from
the institute’s coupled global climate model. Improved geologic information
and technological power continue to advance such models. Courtesy of NCAR.
“The big climate models are remarkable achievements,” says Richard
Alley, a paleoclimatologist at Pennsylvania State University in University Park.
“The amount of work that goes into them and how rapidly they do it …
are really very impressive,” and carried out with “a lot of skill.”
In the past decade, the models’ accuracy has also increased dramatically,
Alley and others say.
When comparing the models, however, “there’s quite a bit of difference,”
says Eric Barron, dean of the College of Earth and Mineral Sciences at Penn
State, who has been watching climate models over the past decade. The leading
models from institutions such as the National Center for Atmospheric Research
(NCAR) in Boulder, Colo., the Geophysical Fluid Dynamics Laboratory at Princeton,
the Hadley Centre in Exeter, United Kingdom, and others, all incorporate particular
physical processes differently and focus on different details.
Modelers generally test their hypothetical Earth climates by doubling carbon
dioxide instantaneously from present levels, which imbalances the energy in
the system. In a feedback loop, the extra greenhouse gas traps thermal radiation
that otherwise would escape out to space, as more sunlight keeps coming. “The
system is going to do everything it can to get back into balance,” says
Jeff Kiehl, a senior scientist in NCAR’s Climate Change Research section.
Fundamental physics says that the system has to warm up.
But in the real world, Kiehl points out, increases in the concentration of carbon
dioxide take longer. “The buildup of carbon dioxide through the use of
fossil fuels causes a gradual warming, which is moderated by the large heat
capacity of the oceans,” he says. Including the deep ocean, the system
takes about 3,000 years to come into equilibrium — a time scale that is
accessible in the geologic record but that, in a model’s world, is “computationally
expensive,” Kiehl says.
Thus, by necessity, models are incomplete and simplified in comparison to the
real world. Coupled climate models link ocean and atmosphere together, and while
most consider changing sea-ice dynamics, others ignore land ice-sheet variability
altogether. But the biggest factors in uncertainty in the models’ results
come from their large scales in time and space, and from an inability to incorporate
small-scale processes that are relatively unknown or cannot be described at
the level of detail that would allow modeling both quickly and with more certainty.
That uncertainty comes into play, for example, with ocean eddies, which occur
on a scale of about 10 to 200 kilometers and which may be a factor in pumping
heat off the equator and determining the path of the Gulf Stream, says Axel
Timmerman, a physical oceanographer at the University of Hawaii at Manoa, in
Honolulu. Computer power partly restricts the inclusion of eddies in the global
models, he says, as well as lack of knowledge: “The equations of circulation
are very well-known, but the equations that capture the small-scale processes,
such as mixing in the ocean or cloud formation in the atmosphere, are not so
well-known.”
Like eddies, cloud processes cannot be “explicitly resolved,” Timmerman
says. Rather, their “gross effect” on the atmosphere is captured in
200- by 200-kilometer grid boxes. Clouds can reflect sunlight, much as ice at
the poles reflects light, decreasing warming in a region. They also indicate
moisture present in a patch of sky. “What we do not know is how the clouds
in a greenhouse-warming world operate. Do they operate as sun shields,”
Timmerman asks rhetorically, “or are they super-greenhouse factories because
of the availability of the most efficient greenhouse gas, water vapor?”
Despite these unknowns, researchers are finding new ways to model large quantities
of data more quickly and at reduced cost, while incorporating new geologic information.
Refining the details
To get around the cost problem, some researchers have used systems similar to
SETI@home and other distributed-computing projects. Thousands
of home computer users program their idle computers to run computations for
the project climateprediction.net, which released its first results in January
(see story, Geotimes, April 2004, and Web Extra, Feb.
7, 2005). That project is trying to pin down the sensitivity of a modified
model originally produced by the Hadley Centre.
As computers get faster and cheaper, modelers expect bigger and better GCMs.
Japanese climate scientists are dedicating one of the fastest computers in the
world to simulate a global coupled climate system at a resolution of a few kilometers,
Timmer-man says, “which will be a major scientific breakthrough.”
Researchers also continue to try to pin down other sources of uncertainty. Tiny
bits of particulate matter — for example, from a highway nearby, with cars
putting out nitrogen and sulfur oxides, or other far away sources — complicate
modeling interactions of clouds and moisture. Such aerosols vary in behavior
and concentration: Some particles, such as soot, are very dark and absorb radiation,
making the planet warmer. Other particles, such as sulfate, which comes from
burning coal, tend to reflect sunlight, cooling the atmosphere. Whereas carbon
dioxide and other long-lived gases get uniformly spread, short-lived particulates
can clump or scatter, varying across distances.
How those particulates interact with each other and with moisture is “a
very knotty problem,” says Drew Shindell, a climatologist at NASA Goddard
Institute for Space Studies in New York City. Small molecules may make a large
difference in cloud cover, Shindell says. Researchers at NASA Ames in California
are studying the indirect effects aerosols might have by changing clouds and
water vapor in general, and finding that the impacts may be smaller than thought
but still significant. Yet despite how little is known, Shindell says, “we
have a lot of information, so that if we are clever, we can attempt to evaluate
the models by comparing with the past.”
 Scientists
continue to elucidate past climate records, turning up some surprises. New data
published in the Feb. 10 Nature shows that over the past 2,000 years,
Northern Hemisphere temperatures recorded in tree rings and lake sediments fluctuated
quite a bit more than earlier studies showed. The variability includes a warmer
period similar to the past several decades that occurred about 1,000 years ago
— which paints a different picture than the “hockey stick” graph
showing relatively steady temperatures that suddenly jumped in the mid-1850s.
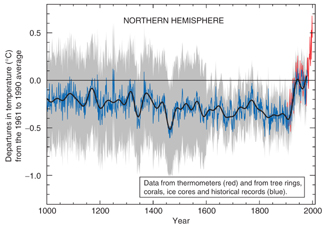
Scientists
continue to elucidate past climate records, turning up some surprises. New data
published in the Feb. 10 Nature shows that over the past 2,000 years,
Northern Hemisphere temperatures recorded in tree rings and lake sediments fluctuated
quite a bit more than earlier studies showed. The variability includes a warmer
period similar to the past several decades that occurred about 1,000 years ago
— which paints a different picture than the “hockey stick” graph
showing relatively steady temperatures that suddenly jumped in the mid-1850s.
Climate scientists have used proxies such as tree rings, ice cores and historical
records (blue lines) and thermometers (red lines) to recreate temperature variability
in the Northern Hemisphere over the past 1,000 years. The resulting “hockey
stick” image has become a flashpoint in the global climate debate, and
new data have shown the stick’s handle (blue) to have even more variability
than previously thought. Courtesy of IPCC.
Modelers are finding that they can match some climate variability as they understand
more about Earth’s processes. “I’m actually very impressed by
the progress in the last few years,” Timmermann says. Most models can simulate
daily weather “quite realistically,” as well as other climate phenomena
— even predicting El Niño events somewhat successfully. “In
that sense, I would trust the latest generation models because they capture,
for example, the dynamic processes in the Pacific Ocean,” he says.
Paleoclimatic modeling is also getting stronger with improved data. Alley of
Penn State says that “paleoclimatic simulations seem to get a lot of things
right,” including the freshening of the North Atlantic 8,200 year ago.
Geologic data show which regions got wetter and which drier, and experiments
with fully coupled ocean-atmospheric models are in “pretty good agreement”
with those changes. “There’s no cheating here,” Alley says. “This
is a model that was built for other purposes, taken and run for that particular
experiment.”
But no model has ever calculated the 100,000-year cycle of ice ages, says Richard
Lindzen, a meteorologist and atmospheric scientist at MIT who does not believe
that current global warming is primarily due to human influences. “It seems
to me you have to have a religious belief in the models” to trust the results,
he says. The models can be “forced” to fit the data. And when it comes
to modeling clouds, some models differ from each other and from observations
by as much as 40 percent, an “error” that is “crucial to the
answers they get,” Lindzen says. “What is the answer to this? To clutch
at everything we don’t know,” including aerosols and other factors.
To account for disagreements between the models, the Program for Climate Model
Diagnosis and Intercomparison at the Lawrence Livermore National Laboratory
in California has been comparing GCMs with varying parameters since 1989. Part
of their work will be factored into the upcoming Fourth Assessment Report from
the Intergovernmental Panel on Climate Change (IPCC), due out in 2006.
The differences in models and scenario ranges highlight their uncertainty a
regional level, although scientists may have a “fairly good sense”
of a plausible range of global warming, says Barron of Penn State. “You
have trouble trusting a prediction for 100 years out, for a particular place,
for a particular time, for particular phenomena. If you are asking what severe
storms will look like in Washington, D.C., in maybe, 2020 — it’s hopeless,”
he says. “There are too many factors that are just unknowable. … I
don’t think there are going to be terrific breakthroughs in the next decade
that will change that.”
Living with uncertainty
The most recent IPCC assessment set the window of global temperature changes
at increases of 1.4 to 5.8 degrees Celsius by 2100. Policy-makers around the
world are struggling over what to do, even as the Kyoto Protocol went into effect
on Feb. 16.
Even if researchers reduce the uncertainty in climate modeling, to pinpoint
temperature changes in a certain place, “you would still not know what
to do to cope with such changes,” says Rosina Bierbaum, dean of the School
of Natural Resources and Environment at the University of Michigan, Ann Arbor,
and former advisor to presidents Bill Clinton and George W. Bush on climate
change issues. “I think it’s a red herring that we have to wait for
really good regional models” before evaluating societal costs and options
for adapting to climate change, she says.
Instead, Beirbaum says, addressing “some crude what-if” scenarios
is necessary: Communities should be thinking about how their current problems
might be exacerbated by climate changes (see stories in this
issue). For example, in the Pacific Northwest, models show snowmelt will
be earlier, by several weeks, she says, which could mean increased summer water
shortages as spring thaws occur earlier. “You don’t need a lot of
really sophisticated modeling to say there’s going to be a big problem
here.”
With the accepted projections from climate models not changing much since the
1980s, says Daniel Sarewitz, director of the Consortium for Science, Policy,
and Outcomes at Arizona State University, Tempe, uncertainty is “as much
a sociological phenomenon as a scientific one,” that reflects politics
as well as “a state of mind of the scientists doing the work” and
their own “confidence in the science that they are doing.” Unlike
deterministic systems, such as flipping a coin, uncertainty in the models is
not measurable in nature — even if the models are perfectly valid. “It’s
not like you have some instrument and you measure it over and over again,”
he says.
In this case, Sarewitz says that meteorologists have the advantage: They make
millions of near-term forecasts and can feed their successes and failures immediately
back into their own modeling systems, which “allows them to continually
improve the science,” Sarewitz says. And, he adds, “it improves the
judgment of the scientists.”
Part of that success means that the users — people watching the Weather
Channel who want to know what the weather will be in their grandma’s backyard
— “get comfortable with the predictions,” Sarewitz says, and
their uncertainties. Most people, however, are not comfortable talking about
climate change, particularly when trying to relate to global average temperature
changes (1 degree Celsius doesn’t sound like much, despite serious effects
projected around the world).
“The closer you are to what really governs the way individuals live are
the things that are hardest to predict,” Sarewitz says. “We’re
going to have to live with a high level of uncertainty probably for a long time,
with the knowledge that the planet is warming.”
 |
Geotimes Home | AGI Home | Information Services | Geoscience Education | Public Policy | Programs | Publications | Careers |