
Check out this month's On the Web links, your connection to earth science friendly Web sites. The popular Geomedia feature is now available by topic.
Arctic Climate Change in Photos
Books:
An Icy History: Frozen
Earth: The Once and Future Story of Ice Ages
Maps:
Mapping Sinkhole Risk in Maryland
“A picture is worth a thousand words,” so the old cliché
goes. And nowhere is that truer than in the Arctic, where scientists are taking
snapshots in time of retreating glaciers, some of which were presented at the
annual meeting of the American Geophysical Union last December. These photos
are “unqualified examples of climate change,” says Bruce Molnia, a
geologist with the U.S. Geological Survey in Reston, Va., whose collection of
Alaskan glacier photos aims to show the Arctic warming trend by comparing the
exact same spot in the early 20th century and again in the 21st century. While
scientists are seeing a significant loss of both glacial area and volume throughout
Alaska, Molnia says, the results can vary. For example, 1 to 2 percent of large
glaciers above 6,000 feet are actually advancing, Molnia says, but the vast
majority of the remaining glaciers in the state are thinning, especially at
lower elevations.
For example, all of the glaciers are retreating near the Arctic National Wildlife
Refuge in northern Alaska, says Matt Nolan, a glaciologist with the University
of Alaska, Fairbanks. He is also documenting Arctic climate change through images
that show glacial retreat.
Vegetation has also been responding to increased warmth and longer summers,
by spreading and changing at an unprecedented rate, says Ken Tape, also at the
University of Alaska, Fairbanks, who has been working on documenting vegetative
changes as part of the Arctic System Science Program. “If you find the
increase in shrubs to be subtle at first glance [in the photos], ask yourself
if there are two times as many shrubs in the new photographs,” Tape says.
The collection of 202 repeated photographs shows a 39 percent increase in shrubs,
he says, and this change has “huge implications” for the Arctic ecosystem.
“The great thing about the photos is that you can make your own assessment
of the change,” Tape says.
These photos are available through several sources, online and in books, such
as Glaciers of Alaska by Molnia. See below for links to Web sites that
feature more of these photos.
Megan Sever
See the April print version of Geotimes for several examples of these
photo pairs from Alaska.
Links:
Earth
Science World Image Bank
EarthSLOT
Land
Atmosphere Ice Interactions
Back to top
 Frozen
Earth: The Once and Future Story of Ice Ages Frozen
Earth: The Once and Future Story of Ice Agesby Doug Macdougall, University of California Press, 2004. ISBN 0 5202 3992 9. Hardcover $24.95. |
Frozen Earth: The Once and Future Story of Ice Ages, Doug Macdougall’s
second book written for general science readers, is a tour through the history
of our knowledge of glaciation through time. He starts with the 19th-century
realization that scoured bedrock, large boulders and other evidence of former
widespread erosion and deposition were not left by the Biblical flood, but by
a flood of ice spreading across Scandinavia, Switzerland and Scotland, and then
leads us through to modern research in glaciology and climatology.
As Macdougall tells, after Swiss naturalist Louis Agassiz presented his ice
age theory, the body of evidence for glaciation grew: evidence for the existence
of vast ice sheets in Earth’s recent past, the history and causes of advance
and retreat, and evidence that ice ages had been part of Earth’s history
almost from the beginning. It was later that James Croll, a self-taught Scot,
showed how cycles of about 100,000 years in the eccentricity of Earth’s
orbit and 23,000-year cycles for precession of Earth’s rotation axis correlated
with the four glaciations in Europe and North America. Although greatly acclaimed
at the time of publication in 1875, Croll’s calculations fell into disfavor,
but were revived in 1920 by the Serbian mathematician Milutin Milankovitch,
who added the 41,000-year cycle for tilt of Earth’s rotation axis. Most
fascinating is Macdougall’s description of several “snowball Earth”
ice ages from 800 to 600 million years ago, during which ice may have covered
the whole planet, both land and sea (see story, this issue).
Macdougall also presents the global efforts and innovative technology used to
extract Earth’s glacial history, with particular attention to cores of
ocean-floor sediments, ice sheets and mountain glaciers. These cores contain
microfossils, volcanic and terrestrial dust, isotopes, air bubbles and stratigraphy,
all of which allow for the mapping and dating of events in Earth’s climatic
history.
The end of the book is devoted to our prehistoric ancestors, our historical
past and our possible future on a planet still in an ice age. Macdougall examines
how the last glaciation cycle interacted with climate to influence human evolution
and migration. The section, however, on human evolution was the most disappointing,
as it was a rehash of old ideas based on scanty evidence. Macdougall notes that
Agassiz and some of the other pioneering figures were devout Christians, and
reluctant to accept slow evolution by natural selection championed by Charles
Darwin.
Throughout the book, Macdougall employs the literary tactic of focusing on a
few people who made landmark contributions to the understanding of our frozen
Earth. He brings these people to life, and instills an appreciation of the difficulties
in formulating new ideas and then getting them accepted, which makes the book
highly readable. A downside of this approach is that many key players get left
out, and showcasing individuals obscures the teamwork that is needed to conduct
modern-day science. For example, the international and inter-institutional collaborations
that went into enterprises such as the International Geophysical Year, in 1957-1958,
led to coring through the great ice sheets of Greenland and Antarctica, uncovering
long records of climate change and initiating studies of ice sheet dynamics.
These studies now tell us that ice sheets can trigger climate change and do
not just respond passively to the slow, long-term variations in insolation that
get so much attention in Macdougall’s book.
Another cooperative venture not mentioned is CLIMAP (Climate: Long-range Investigation,
Mapping and Prediction), a project of the International Decade of Ocean Exploration
from 1970 to 1980. Headed by John Imbrie, it developed “transfer functions”
that allowed ocean surface temperatures to be mapped globally for the past 20,000
years or more, by using the abundances of environmentally sensitive microorganisms
recovered as fossils in ocean-sediment cores.
A third international technological breakthrough has been the use of Earth-orbiting
satellites to provide continuous data on Earth’s weather and climate, and
ongoing dynamic changes in the planet’s two remaining ice sheets. These
new technologies and projects will allow us to better understand how our activities
may alter the future climate and glaciation, and in the meantime, books like
Frozen Earth will continue to open a window to the past.
 Karst is
a hidden hazard affecting many regions. It forms when water dissolves limestone,
gypsum and other rocks, and can create sinkholes, sinking streams and springs.
The Maryland Geological Survey has recently completed a four-year investigation
of karst and the geologic factors that may influence the number, size and distribution
of sinkholes in the Frederick, Md., region. A geologic map forms the basis of
the study, as it can generate a predictive model to show the relationship between
specific rock units and karst development.
Karst is
a hidden hazard affecting many regions. It forms when water dissolves limestone,
gypsum and other rocks, and can create sinkholes, sinking streams and springs.
The Maryland Geological Survey has recently completed a four-year investigation
of karst and the geologic factors that may influence the number, size and distribution
of sinkholes in the Frederick, Md., region. A geologic map forms the basis of
the study, as it can generate a predictive model to show the relationship between
specific rock units and karst development.
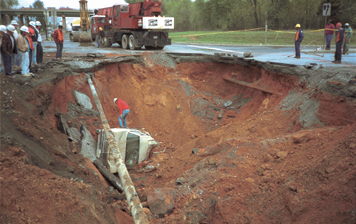
In the fall of 1995, minor injuries resulted
from the catastrophic collapse of South Street in Frederick, Md. Photo by J.P.
Reger
Funded by the Maryland State Highway Administration, the 101-page study, Maryland
Geological Survey Report of Investigations No. 75, describes in detail the
varying character of the soluble rocks that underlie the area around Frederick,
and discusses how sinkholes and other solution features are distributed with
respect to these rocks. The study utilized GPS, for precision, to locate the
more than 1,800 solution features that are identified on the map. All of these
karst features are summarized, along with the geology, on the 1:50,000-scale
map.
Detailed 1:24,000-scale digital geologic and karst feature maps of individual
7.5-minute U.S. Geological Survey quadrangles comprising the project area are
available from the Maryland Geological Survey for the Buckeystown, Point of
Rocks, Frederick, Walkersville, Woodsboro and Catoctin Furnace quadrangles.
For more information or to purchase either the report or individual maps, visit
www.mgs.md.gov.
 |
Geotimes Home | AGI Home | Information Services | Geoscience Education | Public Policy | Programs | Publications | Careers |