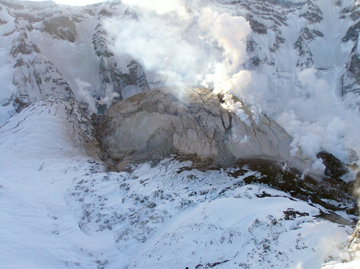
Geotimes
Untitled Document

Geophenomena

Locating “spritely” lightning
Mount St. Helens still erupting — a lot
Japanese volcano up close

Locating “spritely” lightning

At any given moment, more than 2,000 thunderstorms are raging around the globe, creating 50 to 100 lightning flashes each second. Occasionally, very intense lightning will produce red flashes above a storm, commonly known as sprites. Researchers are now using a property of the sprites to better locate lightning and thus learn more about weather, aviation hazards and Earth’s global electric circuit.

Time-lapse photography captures multiple cloud-to-ground strokes of lightning during a nighttime thunderstorm in Norman, Okla. Monitoring lightning in real-time could help weather studies and improve understanding of the global electric circuit. Courtesy of NOAA Photo Library, NOAA Central Library; OAR/ERL/National Severe Storms Laboratory.


Discovered only 15 years ago, sprites — formally called transient luminous events — are not well understood. They may affect the chemistry of the upper atmosphere and present a hazard to space flight, but scientists do not yet know how many occur or how often. The same intense lightning that causes sprites also emits extremely low-frequency radio waves, called Q-bursts.

“Monitoring these Q-bursts from a single ground station may allow us to track global transient luminous event activity,” says atmospheric scientist Colin Price of Tel Aviv University. He and colleague Eran Greenberg, an electrical engineer, have developed a new, improved method of pinpointing lightning from a single monitoring station. “Our radio-wave method of locating intense lightning may be a first step in describing the climatology of transient luminous events.”

Q-bursts set up standing electromagnetic waves that circle the globe a few times in the space between Earth and its ionosphere before decaying. The waves occur at a few particular, extremely low frequencies and have a wavelength equal to the circumference of Earth. Because the electrical field and the magnetic field of the waves begin out of phase with each other, researchers can calculate how far the wave traveled by looking at the fields’ relative positions when the wave arrives at their observatory in the Negev Desert.

To test their method, on a single night in January 2003, Greenberg and Price isolated signals that were three to five times larger than the background noise of global lightning flashes. They identified 147 events and found their origins. They then compared those results with that night’s satellite records of infrared cloud top temperatures, an indicator of areas of intense thunderstorm activity. The researchers say that their method offers a “significant improvement” on the accuracy of previous methods.

However, Dennis Boccippio, a lightning researcher at NASA’s Marshall Space Flight Center in Huntsville, Ala., disagrees. He developed a similar single-station method in 1998 that combined the electric and magnetic fields to find distance.

Boccippio says that because the location error depends on the distance to the strikes, which varies from storm to storm, the authors should have run the same data through the various methods to accurately compare their error rates. Had that been done, he adds, “I suspect, based on the first principles the authors state, that this experiment would have shown such an improvement, but that wasn’t actually done in the study.”

Global lightning networks currently use satellites or methods that use very low frequencies (VLF), which are higher than extremely low frequencies. VLF requires multiple stations, has a less-than-global range, and the higher frequencies result in bulkier datasets. Still, VLF methods “provide information on each individual flash within a few thousand kilometer range,” Price says. “A combination of the methods would be valuable.”

Being able to monitor lightning in real time could have implications for the safer study of weather, the remote monitoring of aviation hazards in areas that lack lightning observations and a more complete understanding of the global electric circuit.

Sara Pratt
Geotimes contributing writer

Back to top


Mount St. Helens still erupting — a lot

“Something extraordinary is happening in the crater at Mount St. Helens,” said Dan Dzurisin, a geologist at the U.S. Geological Survey Cascades Volcano Observatory (CVO), at a press conference at the annual meeting of the American Geophysical Union in December in San Francisco. The eruption that began on Sept. 23 has shown no signs of stopping. Instead, the volcano is erupting a dump-truck-load of fresh hot rock every second of the day — that’s five cubic yards per second, he said — in the form of an ever-growing lava dome. Thus far, the lava dome has grown by as much as the size of the world’s largest aircraft carrier.

The growing lava dome at Mount St. Helens. Courtesy of Mike Poland/USGS.

While the scientists monitoring the volcano say that the immediate danger passed in October, the potential for large portions of the dome to collapse without warning becomes greater as the dome continues to grow, said Cynthia Gardner, also of CVO, at the meeting. Such a collapse could lead to pyroclastic flows, snowmelt, ensuing lahars (mudflows) and ash clouds. Mount St. Helens still hazardous, Gardner said, but beautiful and fascinating.

Megan Sever

Back to top


Japanese volcano up close

In July, researchers in Japan drilled into the heart of Unzen volcano, and got the world’s first direct observation of the inner workings of an active volcano. The scientists successfully drilled into the conduit of the lava from Unzen’s 1991 to 1995 eruption, and presented results at the December meeting of the American Geophysical Union.

Since the eruption ended, John Eichelberger, a geologist at the University of Alaska, Fairbanks, and colleagues in Japan have been drilling into the volcano (see Geotimes, March 2004). “The truly amazing thing is to actually have done it — to get there and find that things were more or less what we expected,” Eichelberger says. Once they hit the conduit, the scientists were able to confirm its position, size (30 meters wide) and shape, as well as ongoing geochemical processes that indicate degassing of the volcano by water.

However, there were two surprising observations, Eichelberger says. The geochemically altered area filled with conduits from other eruptions (called the conduit zone) that surrounds the main conduit is hundreds of meters wide — much wider than the scientists thought.

The other surprise was the low temperature of the conduit: about 200 degrees Celsius. When the eruption ended in 1995, the temperatures near the conduit were about 850 degrees Celsius, Eichelberger says, and the researchers didn’t expect it to cool as quickly as it did. “But maybe we should have expected that,” he says, “as we didn’t project for hydrologic variation on the temperatures, and hydrologic processes were certainly involved here.”

Now that the initial excitement is over, Eichelberger says, it is time to get down to business in the lab to try to understand all the samples and data they have collected. “We have an opportunity here to understand what happens as magma rises” to the surface of a volcano, he says. “We want to see if we can figure out exactly what happened down there.”

Megan Sever

Link:

"Looking into a volcano: drilling Unzen," Geotimes, March 2004


Back to top

Untitled Document

Geotimes Home | AGI Home | Information Services | Geoscience Education | Public Policy | Programs | Publications | Careers

© 2024 American Geological Institute. All rights reserved. Any copying, redistribution or retransmission of any of the contents of this service without the express written consent of the American Geological Institute is expressly prohibited. For all electronic copyright requests, visit: http://www.copyright.com/ccc/do/showConfigurator?WT.mc_id=PubLink