
Geotimes Home | AGI Home | Information Services | Geoscience Education | Public Policy | Programs | Publications | Careers

Geologic maps of Earth's surface can be templates in forecasting landscape
change. Surficial geologic maps are vital to understanding and predicting the
effects of climate and associated hydrologic changes, monitoring human impacts
on landscapes, understanding how ecosystems function, and mitigating the effects
of geologic hazards. Surficial geologic maps are multipurpose and are necessary
to evaluate diverse landscape attributes, particularly when the maps are combined
with databases of physical properties associated with the deposits. As landscape
responses are tightly coupled to climatic and hydrologic stresses, sedimentary
sequences provide invaluable records of past climate, which in turn can be used
to infer possible consequences of future climate variability or anthropogenic
influences, such as changes in the land cover.
The Kingston Range debris-flow fans. See text for description. Figure courtesy
of Kevin Schmidt.
Recent efforts to forge interdisciplinary ties to forecast landscape change
with respect to anticipated droughts (e.g., Brent Newman et al., 2003; Kevin
Schmidt and Robert Webb, 2001), have determined that a vital foundation for
these predictions is knowing the distribution of surficial materials. At the
same time, despite their importance, detailed surficial geologic maps are lacking
for much of the United States. Historically geologic mapping was focused on
bedrock geology. Much of the East Coast has good coverage of surficial geologic
maps but the Central and Western U.S. has only sporadic coverage.
Landscapes and their associated ecosystems are interwoven physical, hydrological
and biological systems that are affected by the presence and type of surficial
materials. Current projects within the U.S. Geological Survey (e.g., deserts,
climate
change, and Mojave
Desert Ecosystem) aim to document ecosystem processes, climate and hydrologic
history, hazard susceptibility and surface process information at a variety
of scales by preparing a series of multipurpose surficial geologic map databases.
The maps and associated databases contain information on the temporal and spatial
patterns of surface processes and hazards, including material properties and
vegetation cover, with which the databases can be used to model specific landscape
responses.
Our interdisciplinary understanding of the links between the magnitude and duration
of climate fluctuations and geomorphic and biotic change are rapidly improving.
Documenting the physical properties of deposits through mapping provides critical
baseline information on the first order availability of water and nutrients
for biota. For example, the spatial distribution of surficial deposits influences
vegetation distribution, ecosystem function and relative susceptibility to fires.
Constraining baseline information provides opportunities to forecast ecosystem
response to climate variability, but the responses are driven by such diverse
influences as topography, lithology, soil thickness, ecosystem type, sediment-transport
process, nutrient availability, and degree of recovery from the last disturbance.
Locally, vegetation responds to climate change via soil moisture that is largely
regulated by the distribution of surficial materials. Unfortunately, assessing
the rate and magnitude of a landscape's response to a disturbance remains relatively
elusive and qualitative because a response occurs over longer time periods than
the duration of historic records. Additional surficial geologic mapping supported
by robust dating can extend historical records, allowing quantitative evaluation
of forcing functions (such as climate variability) and of the corresponding
erosion and deposition of material.
Mapping of surficial geology can document the spatial distribution and timing
of deposits related to specific sediment-transport processes. Along with information
on deposit thickness, the geologic record can be used to estimate deposit volumes
and relative activity of transport processes over time, and thereby used to
predict future deposition rates (see the sidebar). For example, even under the
presently arid climate, alluvial fans in the southwestern United States episodically
flood and deposit sediment. Recent research in the Kingston Range of the Mojave
Desert, California has combined geologic mapping, surveying, and geographic
information system (GIS) modeling to distinguish debris-flow deposits and their
relative ages, to estimate volumes of age-stratified deposits, and to infer
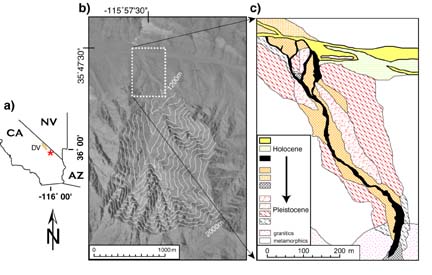
minimum watershed-scale erosion rates. The Kingston Range (Fig. 1a) has numerous
debris-flow fans located near the outlets of steep watersheds (Fig. 1b). Mapping
of debris-flow deposits (Fig. 1c) provides a means to determine the amount of
material transported during time intervals representative of different climatic
cycles. Debris flows are similar in age to nearby fluvial deposits suggesting
that floods and debris flows were active simultaneously. Field mapping identified
historic debris-flow deposits containing asphalt and an automobile (roughly
1930's vintage), underscoring the relevance of the study. Distances traveled
by debris flows can also be inferred from mapping; one massive debris flow lies
25 km from the source rock! Pleistocene debris-flow deposits are more voluminous
than Holocene deposits, but when time-averaged, the Holocene rates exceed Pleistocene
rates because they are averaged over shorter time periods. By comparing the
geologic record of deposits and contemporary estimates of landslide susceptibility
from GIS modeling, it is possible to constrain forecasts of debris flow activity
in response to climatic or land use disturbances.
Although landslide rates are low in most areas, landsliding within shallow soil
on steep hillslopes is highly sensitive to vegetation changes. In mountainous
areas of managed land, the impacts of vegetation die-off arising from mega-drought
(Stephen Gray et al., 2003), timber harvest or fire may weaken root strength
within granular soils (Joshua Roering et al., 2003). Decreased root reinforcement
can heighten regional landslide susceptibility, particularly during large storms.
Forecasts of landsliding benefit from mapping of both source material and deposits
through geologic time and from dating to constrain deposit ages. They also benefit
from time-series analyses of remote-sensing imagery to document the distribution
of regolith and vegetation type and health.
The investigation of surface processes to evaluate interdisciplinary landscape
dynamics diversifies the use of geologic maps. A comprehensive geologic map
can have many unique applications, and through the use of GIS techniques geologic
maps are no longer static documents (e.g., Geotimes
2002). Rather, derivative maps, created for specific purposes, can be generated
from an original geologic map database and tailored to any particular application.
Ongoing research efforts aim to develop remote sensing techniques for extending
mapped surficial geology and physical properties into unmapped areas and produce
derivative maps of paleohydrology (shallow groundwater, spring activity, lakes),
geologic hazards (surface rupture via faulting, deep-seated landsliding, debris
flows), and sediment transport by surface water and wind through space and time.
Learn about U.S. Geological
Survey mapping programs aimed at understanding ecosystem changes.
Visit:
Our
Dynamic Desert Web site
Climate
change and land use
Where
desert meets city
Back to index
|
Geotimes Home | AGI Home | Information Services | Geoscience Education | Public Policy | Programs | Publications | Careers |