|
 Subscribe

FEATURE
Storm Soundings: New Technologies for Tracking Hurricanes
Carolyn Gramling
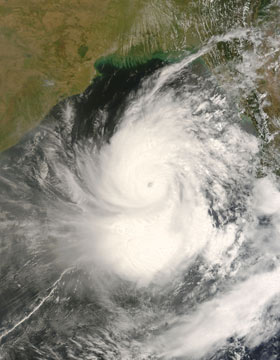 NASA image courtesy of Jeff Schmaltz, MODIS Rapid Response |
| Cyclone Nargis approaches Myanmar on May 1, a day before making landfall. |
On May 2, a powerful Category-4 cyclone roared into the Irrawaddy Delta of Myanmar in southeastern Asia. The cyclone — named, incongruously, Nargis, the Urdu word for daffodil — became the deadliest natural disaster in Myanmar’s history, leaving at least 78,000 people dead and more than 50,000 missing.
Nargis initially became a cyclone on April 28, but two days later it was weakening, almost reduced to a tropical storm. On May 1, however, Nargis began rapidly intensifying. Almost overnight, it transformed into a powerful super-cyclone, churning on an eastward track across the Bay of Bengal and reaching peak wind speeds of 266 kilometers per hour (165 miles per hour) before making landfall in Myanmar.
In its wake, it left widespread devastation — a painful reminder of how abruptly such a powerful storm can grow.
Scientists still hotly debate what effects climate change might have on the intensity of future hurricanes. But all agree that the current period of increased storm activity highlights a problem that already exists: rapid population growth along coastlines, which — even without more super-storms — could lead to dramatically increased human and economic losses.
Scientists have honed their forecasting abilities in recent years, especially their predictions of hurricane paths and timing. Predicting the intensity of storms remains a challenge, however. Even beyond the long-term seasonal predictions of intensity, the short-term ability to assess quickly and accurately when, or if, storms such as Nargis will rapidly intensify remains a challenge. Powerful storms such as 2004’s Hurricane Charley and 2005’s Hurricanes Katrina and Rita also highlighted this problem, as they intensified extremely rapidly in the Gulf of Mexico before cutting wide swaths through Louisiana, Texas and Florida.
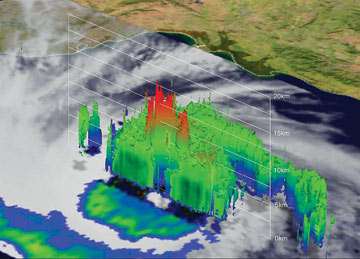 Image produced by Hal Pierce (SSAI/NASA) |
| NASA’s Tropical Rainfall Measuring Mission (TRMM) satellite observed Cyclone Nargis bearing down on Myanmar in late April. The tall, red half-ring represents intense rainfall in the eyewall of the storm — potentially signs of future intensification. Although weakened briefly, Nargis regained strength quickly before making landfall as a Category-4 cyclone on May 2. |
The ability to quickly gauge how a storm’s strength is changing prior to landfall could help alleviate losses along coastal regions. And with potentially busy storm seasons looming in 2008, a heightened sense of urgency is prompting new advances in technology, as researchers look for new, speedier ways to anticipate an approaching storm’s power.
Hurricane hunting
In the Atlantic Ocean and the Gulf of Mexico, the best information on a hurricane’s fluctuating strength has, for decades, come from airplanes. “Hurricane hunters” — a fleet of research aircraft, including both the U.S. Air Force Reserve’s fleet of 10 WC-130 turboprop planes and NOAA’s two heavily instrumented Lockheed WP-3D Orion turboprops, nicknamed “Kermit” and “Miss Piggy” — take turns flying through the maelstrom. Battered by fierce winds, rain and bursts of static electricity as they cut through the eyewall — the centermost ring of towering, swirling clouds that contains a cyclone’s most intense rain and winds — the planes drop parachuted instruments (dropsondes) into the eyewall and the eye. The instruments collect and transmit data on barometric pressure, humidity, temperature and wind speeds as they fall toward the ocean. Those direct measurements, scientists say, are the most accurate way to assess a storm’s power.
Therefore, even after the addition of weather satellites in the 1970s, hurricane hunters remain an essential part of predicting a storm’s future. “Satellites are excellent at tracking storms,” says Nick Makris, director of MIT’s Laboratory for Undersea Remote Sensing. “But the errors can be 50 percent at estimating destructive power.” That is because satellites cannot provide accurate wind speed or pressure data, which meteorologists need to assess a storm’s power and predict whether and how it might intensify.
Scientifically speaking, “power” is defined as the force of the wind — how strongly it pushes against an object in its path — multiplied by how fast it then moves that object along. Eight kilometers per hour is a light breeze; kite-flying weather is about 16 kilometers per hour. But even at 32 kilometers per hour — still only a fraction of hurricane-strength wind speeds — “you start to see white caps forming on a lake and you’re going to notice that the wind is pushing you around a little bit,” Makris says.
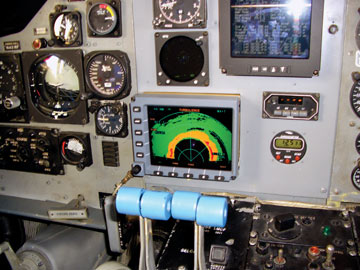 NOAA |
| Hurricane hunters keep close watch on 2005’s Hurricane Katrina, both with instruments and outside the window. |
 NOAA |
Estimating an actual storm’s power can be tricky. The power of the wind is proportional to the cube of the wind speed, so small differences in measurements of wind speed can have large impacts on power calculations. “It really goes up dramatically,” Makris says. “You’ve got to measure that wind speed pretty accurately to understand how powerful a storm is going to be.” The problem, therefore, is how to get both frequent and highly accurate measurements of wind speed — from out in the ocean, in the middle of a raging storm.
But flying into a hurricane has its drawbacks: It is both dangerous and expensive, Makris says. “That’s one of the reasons [hurricane hunters are] only flown on the East Coast [of the United States] and in the Gulf. There are no measurements of hurricanes’ destructive power routinely done in any other part of the world. And the most frequent occurrences are in the Pacific,” he says.
Furthermore, aircraft can only fly through a storm every few hours, which means that they might not capture quick changes in an approaching hurricane, says Wen-Chau Lee, a climatologist at the National Center for Atmospheric Research (NCAR) in Boulder, Colo. And as a storm gets closer to the coast, “the influence of land makes the convection more intense. It’s more dangerous to fly in that situation,” Lee says.
Recent controversial cutbacks in funding for the hurricane hunters are also a concern. In 2007, NOAA confirmed cuts to the program, reducing the total number of flights. The agency said it could still accomplish its missions by combining reconnaissance and other weather-related research flights into one mission. But the outspoken former director of the National Hurricane Center, Bill Proenza, blasted those and other budget cuts as weakening the agency’s ability to anticipate storms.
Given these concerns, Makris says, scientists are looking to find a method to quantify a hurricane’s power that is cheap, accurate and safe.
Singing bubbles
While discussing hurricane projects with MIT climatologist Kerry Emanuel, Makris says, they arrived at the subject of sound, which happens to be Makris’ specialty. “Kerry asked if we could learn something about hurricanes from listening to sound. I said yes — definitely.”
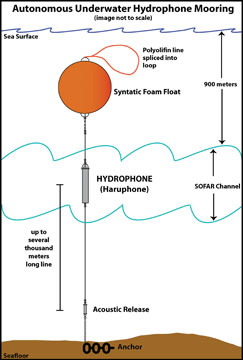
Rather than sound in the atmosphere, he says, they were talking about sound traveling underwater. The ocean is full of noises, both natural and anthropogenic. And since World War I, people have scanned the seas to locate the origins of these sounds (particularly the sound of an enemy submarine). To better track those sources, scientists invented the hydrophone, a kind of underwater microphone moored to a buoy or planted on the seafloor, that picks up sounds transmitted through the water. The hydrophone then converts those acoustic signals to electrical energy, which scientists can dissect to determine the signals’ source.
Whale songs and dolphin whistles aside, the dominant source of natural sounds out in the open ocean is bubbles. When strong winds whip up crashing waves at the surface, the boundary separating the ocean from the atmosphere becomes fuzzy: The ocean enters the atmosphere as sea spray, and bubbles of atmosphere become absorbed into the ocean. Those bubbles resonate within a spectrum of sound that peaks at an octave above the normal human speaking range, but still lies within the singing range.
By World War II, scientists began to better understand the link between wind speeds at the surface and underwater sounds. Wind power, they found, is closely correlated with the intensity of these sounds when measured at certain frequencies — the lower end of the frequency range that humans can hear. That correlation, they found, holds true for wind speeds up to 40 knots (40 nautical miles per hour, equivalent to about 74 kilometers per hour).
Forty-knot winds aren’t quite hurricane-strength; to reach Category 1 status, a hurricane must hit sustained wind speeds of 119 kilometers per hour. However, at higher wind speeds the correlation was thought to break down because the sound waves would not be able to penetrate a thick bubble layer. Yet Makris suspected it might be possible to push that correlation further.
Ear on the hurricane
To do the math, Makris says, he needed data — ideally, from a hydrophone already out in the middle of the ocean that also happened to lie in a hurricane’s path. Scientifically deployed hydrophones are scattered throughout the oceans, designed to keep tabs on ocean sounds ranging from volcanic eruptions and earthquakes on the seafloor to the long-distance calls of blue whales. But finding one in precisely the right spot was still a challenge. After superimposing multiple hurricane tracks with known hydrophone locations in the Atlantic Ocean, Makris and former MIT graduate student Joshua Wilson, now at Applied Physical Sciences Corp., a consulting firm based in Groton, Conn., found one match — a NOAA hydrophone located below 800 meters of water on the mid-Atlantic Ridge.
In September 1999, Hurricane Gert was chugging across the Atlantic Ocean, taking a westward track from the coast of Africa across the mid-Atlantic Ridge. Its path took it directly across that hydrophone. A few years later, Makris and Wilson played back the sounds the hydrophone had heard, making calculations of the wind speed-sound correlation in hurricane-force conditions.
 NOAA |
| A diagram of a NOAA hydrophone deployed on the seafloor. |
They compared their results with data from a hurricane hunter plane, which had flown over the storm less than a day later. Using only the hydrophone data, they were able to estimate the actual storm’s wind speeds with only a 5 percent error — the same error as the hurricane hunter aircrafts’ measurements. “We got this beautiful correlation,” Makris says. Their finding, published May 21 in Geophysical Research Letters, was the first experimental validation of the method.
Because repeated experimental validations are so essential to getting funding for larger-scale programs — and, perhaps, for ultimately planting a field of hydrophones in coastal waters to listen for storms — Makris is now planning to test his theoretical calculations further. Last year, in collaboration with the Mexican Navy’s Directorate of Oceanography, Hydrography and Meteorology, he installed a hydrophone in one of the most hurricane-prone regions of the world — near the island of Socorro, just off Mexico’s western coast.
But as it happens, no storm with winds stronger than 74 kilometers per hour passed near the area. Even at those wind speeds, Makris says, “we’re seeing interesting stuff. But we want to do it again. We want higher winds.”
Tracking intensity in 3-D
Meanwhile, on the opposite coast, scientists from NCAR and the U.S. Naval Research Laboratory are teaming up with the National Hurricane Center to test another new hurricane tracking method this season. Their method is based on an already existing network of Doppler radar lining the southeastern coast of the United States. Using a new model, the scientists, led by Lee, plan to extract even more information from the Doppler data. The model, they say, will provide more precise wind speeds so that forecasters can more accurately assess a storm’s fluctuating intensity.
The national network of Doppler radar, which went online in the early 1990s, provides the National Weather Service with continuous data on weather patterns. The radar stations send out radio waves that bounce off objects in the atmosphere, such as raindrops and snow crystals, and then record the bounced-back signals. If an object is moving away or toward a station’s antenna, its frequency will change; the stations use those changes in frequency to determine the direction and speed of winds.
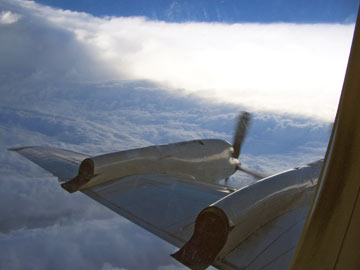
 NOAA |
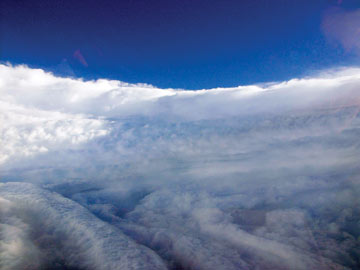
| The eyewall of Hurricane Katrina, a swirling band of towering, intense thunderstorms ringing the storm’s center, is captured from a NOAA WP-3D Orion hurricane hunter aircraft in August 2005 before the storm made landfall. |
But to get highly accurate wind speed data from an approaching storm — necessary to track its intensity — you need to create a 3-D picture of its winds. One way to do that would be to use more than one radar station, Lee says, but the Doppler radar stations on the coast are too far apart.
So, he says, they came up with a method that can use the data from a single Doppler radar. Dubbed VORTRAC (Vortex Objective Radar Tracking and Circulation), the system uses the radar’s data to “extract the circulation of a hurricane,” Lee says. “Hurricanes are a vortex — they’re swirling in nature. We take advantage of the vortex nature of the storm.”
The primary wind flow pattern in a hurricane is its swirling, he says. By making the assumption that those rotating winds are more powerful than wind flowing into or out of the storm, Lee and his team can use the wind flow patterns to derive equations that can match the radar’s determination of wind velocities. “In the majority of situations that’s a very good assumption,” he adds. It also happens to work better for the stronger storms, such as those of Category 3 and above, with sustained wind speeds of at least 178 kilometers per hour, he says.
With VORTRAC, scientists can get data on a storm’s circulation every six minutes, as long as the storm is within Doppler range, Lee says. That range extends about 200 kilometers offshore. “Whenever there is a storm coming within 200 kilometers of the coastline, we’ll turn on the system,” he says.
The National Hurricane Center plans to test VORTRAC during the 2008 Atlantic hurricane season, which began June 1. “It’s not going to be replacing the aircraft, but what it can do is that 10-minute update on the information,” says Chris Landsea, a meteorologist and the science and operations officer at the National Hurricane Center. “The radar is scanning the whole hurricane all at once. Aircraft can only sample a little piece at one time. And it’s quite a bit more information, especially from a rapidly intensifying hurricane.”
 NOAA Photo Library, NOAA Central Library, OAR/ERL/National Severe Storms Laboratory |
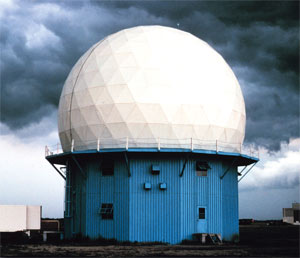
| NOAA’s first Doppler weather radar station, built in the early 1970s, was placed in Norman, Okla., to keep an eye on the horizon for approaching tornadoes. |
The coastal radar can only give perhaps six to 12 hours of warning (depending on how fast the storm is moving) before a storm makes landfall. That’s not quite enough time for emergency management officials to organize a full-scale evacuation, Lee says, but still enough time for residents themselves to realize it’s not safe to stay and to evacuate, or to take appropriate steps to shore up their housing and take shelter.
One possible way to extend that lead time in the future, he adds, might be to install the radar on the NOAA hurricane hunter planes, which can travel thousands of kilometers out across the ocean. “The question is how to send the instrument into a storm far enough from the coastline to make a difference,” Lee says.
The coming storms
Scientists at NOAA’s National Hurricane Center are predicting that the 2008 Atlantic hurricane season is going to be an active one, likely to have at least 12 named storms. They anticipate six to nine hurricanes, several of which are predicted to become major hurricanes (Category 3, 4 or 5 on the Saffir-Simpson scale).
Such a busy season may provide ample opportunity to test these new technologies, as well as others that NOAA is working on, Landsea says. These include new techniques to measure wave heights beneath the hurricane from aboard the research aircraft to provide warnings to mariners and new computer models for hurricane forecasting.
“The National Hurricane Center will use what tools it can,” Lee says. “Most of the time they are complementary, because when one doesn’t [work], others will.”