Geotimes

ENERGY NOTES

Consumption Measured in quadrillions (10 to the 15th) of British Thermal Units
  January 2001 January 2002 Percent Change
Nuclear 0.73 0.75 2.2
Petroleum 3.30 3.18

-3.7

Natural Gas 2.70 2.43 -9.9
Coal 1.99 1.88 -5.4
Hydro 0.21 0.24 13.9
TOTAL 9.23 8.78 -4.9

Production
  January 2001 January 2002 Percent Change
Domestic oil production
TOTAL
7.55 8.16 8.0
Crude Oil 5.84 5.93

1.7

Natural Gas
Plant Liquids
1.38 1.83 32.8
Coal
(millions of short tons)
97.02 97.12 0.1
Natural Gas
(trillions of cubic feet)

1.67 1.59 -4.7

Consumption and Production data are taken from the Energy Information
Administration’s
Monthly Energy Review. All numbers are rounded to two
significant digits but percentages reflect unrounded numbers.

Oil & Petroleum Imports (In millions of barrels per day)

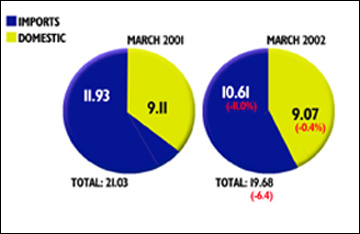
Oil and Petroleum Imports data are taken from the American Petroleum
Institute’s
Monthly Statistical Report and represent estimates. Final numbers come
from the Department of Energy two months following the API estimates.

Read this month's feature story in Energy & Resources: Caribou study charges heated energy debate


Geotimes Home | AGI Home | Information Services | Geoscience Education | Public Policy | Programs | Publications | Careers

© 2024 American Geological Institute. All rights reserved. Any copying, redistribution or retransmission of any of the contents of this service without the express written consent of the American Geological Institute is expressly prohibited. For all electronic copyright requests, visit: http://www.copyright.com/ccc/do/showConfigurator?WT.mc_id=PubLink