The Long Summer: How Climate Changed
Civilization
by Brain M. Fagan. Basic Books, 2004. ISBN 0 465 02281 2. Hardcover,
$26.

Check out this month's On
the Web links, your connection to earth science friendly Web sites. The
popular Geomedia feature now available by topic.
Book Review:
The Long Summer
Museum Review:
New science museum in the nation’s
capital
Maps:
New maps from the U.S. Geological Survey
|
The Long Summer: How Climate Changed
Civilization |
Climate and humanity are dancing. The global weather system is leading our
developing species across the parquet, serving as both band and dancer. In response
to each mercurial change in tempo, its human partner must innovate new moves
or migrate to a new part of the dance floor. Evidence of the dance is left behind
in climatic proxies such as tree rings, pollen grains and deep cores of glacial
ice, as well as artifacts like grain baskets, cave paintings and Clovis spear
points.
In The Long Summer: How Climate Changed Civilization, Brain Fagan describes
this climatic dance and the immense role it plays in shaping the development
of human civilization. Fagan says that when the weather shifts, people react,
and history is writ. A professor emeritus of anthropology at the University
of California, Santa Barbara, Fagan synthesizes the work of dozens of scientists
in piecing together a climatic waltz through time.
Fagan’s story begins at the conclusion of the last ice age: the beginning
of the titular “long summer” in which civilization arose. Fagan describes
the tundra landscape of Europe as “breathing.” When weather is warmer,
animals and humans flood in. When the climate turns colder, they are “exhaled”
to the south.
This warming contributed to the extinction of a majority of the planet’s
megafauna and a transition to more sedentary societies. By no means was this
an instantaneous process: The pyramids of Giza were being constructed while
mammoths were still living in Siberia.
Synthesizing work by Steve Hostetler, Wallace Broecker and Jim Teller, Fagan
argues that Mesopotamian humans became agriculturists in response to the draining
of glacial Lake Agassiz in North America. Warming climate caused the lake’s
ice dam to breach, emptying the enormous reservoir. Without the moderating influence
of this northerly body of freshwater, climatic shifts caused an Atlantic conveyor
shutdown, provoking the Younger Dryas cooling event. In Mesopotamia, this meant
that traditional food supplies began to vanish. People turned to agriculture
as a means of surviving this transition, but by the time the Atlantic began
circulating again, farming had become a habit too engrained to break.
Similarly profound, Fagan presents an account based on William Ryan and Walter
Pitman’s theory of the flooding of freshwater Euxine Lake (the ancestral
Black Sea) by the salty Mediterranean in 5,600 B.C. Over two years, the waters
rose as much as 15 centimeters per day, an event credited with causing a mass
exodus from the region, thereby populating much of Europe and the Near East,
as well as being the source of the biblical flood story (see Geotimes,
February 2004).
Fagan postulates climatic determinants for many trends in human society. Drawing
on studies by Harvey Weiss, Joy McCorriston, Frank Hole and Samuel Kramer, he
makes the argument that irrigation caused the development of urban communities.
One chapter describes the influence of El Niño events on the course of
history. Another chapter describes how the competition for European dominance
between Celts and Romans was largely decided by the position of the transition
between Mediterranean and temperate habitats. As that line shifted, so did the
fortunes of empires. There is also a fascinating exposition on the unlikely
development of cattle herding culture in the Sahara. And, with David Hodell’s
Caribbean gypsum-calcite ratios to back him up, Fagan pins the collapse of Mayan
civilization on cyclical droughts.
In describing the various lines of research, Fagan does well at providing portraits
of the motives and personalities of some of the scientists involved. One of
the most notable examples is the archaeologist Alfred Rust, who bicycled from
Syria to Germany after his funding ran out.
Fagan has visited many of the archaeological sites that tell the human side
of this tightly interwoven dance for two. However, his travelogues are often
the weakest part of the book, as the anecdotes sometimes smack of melodrama.
He opens the book on a dark and stormy night, for instance, where he is self-rendered
as a stalwart adventurer caught in an ocean tempest. He redeems himself in another
chapter with a tender and reverent description of the cave paintings at Niaux
in France.
The book ends with a caution: Fagan argues that history’s larger trend
is that we buffer ourselves against the short-term vicissitudes of meteorology
only to make ourselves susceptible to longer-term climate variation. “The
whole course of civilization may be seen as a process of trading up on the scale
of vulnerability,” Fagan writes. In addition to the unlucky civilizations
profiled in The Long Summer, this has implications for all of modern
society.
Written for a broad audience, the book contains more “whiz bang” than
the average climatologic journal article. It is a reasonably easy read, with
enough scientific details to whet the geologic appetite.
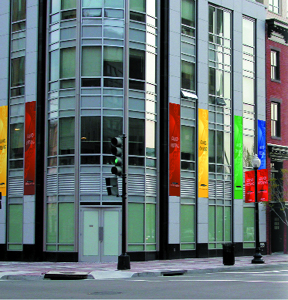
New science museum in the nation’s capital
|
|
| The Marian Koshland Science Museum is open every day but Tuesday from 10 a.m. to 5 p.m. It is located at 6th and E Streets, NW, in downtown Washington, D.C. Admission is $5 for adults and $3 for seniors and students. |
In Washington, D.C., a city chock-full of world-class exhibitions, yet another
museum entered the scene this spring. The new, state-of-the-art Marian Koshland
Science Museum, sponsored and run by the National Academy of Sciences (NAS),
offers the high-level scientific information contained in NAS reports to the
public through captivating interactive exhibits.
NAS produces several hundred highly technical scientific reports each year,
ranging in topic from global warming and environmental considerations to medicine,
genetics and engineering. Many of the scientists who are involved in the reports
are also involved in the museum. The museum’s creators combed exhibits
around the world to find the most innovative displays and incorporated many
of those aspects into this new museum.
“Parents really like it, kids really like it — and together they like
it even more,” says Daniel Koshland, a biochemist who founded the museum
in honor of his late wife, Marian, who was a renowned molecular biologist and
immunologist. NAS designed the museum, he says, to appeal to the average family
visiting the nation’s capital.
Just blocks away from the Smithsonian museums, visitors to the Koshland Museum
will learn about some of the fascinating facets of science that are in the public
eye, including the causes and effects of global warming, and how scientists
use DNA sequencing to solve crimes or prevent epidemic diseases. The aim, Koshland
says, is to show how science affects people’s lives every day.
The first exhibit is a broad, introductory multimedia presentation called the
Wonders of Science. It is the museum’s only permanent exhibit; in two years,
the other exhibits will travel on tour. Interactive kiosks and a short video
introduce visitors to some of the groundbreaking research that is unraveling
the many mysteries of the universe.
After the video, visitors enter a compact but airy room filled to the brim with
current facts about global warming and possible future effects. A giant orange
globe beckons with the promise of illustrating the greenhouse effect firsthand:
Each side of the globe simulates the extra warmth in an amplified greenhouse-heated
world versus a naturally heated world. Global warming is a global problem, the
exhibit says, but will be felt locally. On another display, by pressing buttons
to raise sea levels and global temperatures, visitors can see what will happen
to their own neighborhood; much of the Chesapeake Bay area, for example, would
be underwater with a minor sea-level rise, according to the exhibit.
This topic — the causes and effects of global warming — is controversial,
Koshland recognizes. But “we take the position of illustrating the best
science,” he says. “We don’t do policy matters” and “we
don’t make science,” he says, but the displays do show visitors what
policies could cost them, as a way of relating big global issues on a very personal
level.
 One particularly
sticky topic is future climate change, which is illustrated in this museum through
a sliding plasma video screen of a world map over a wall-sized graph. The exhibit
shows where and by how much temperatures and carbon dioxide levels are predicted
to rise, according to climatic models from the National Center for Atmospheric
Research and the Geophysical Fluid Dynamics Laboratory. Visitors can also examine
what leads to the uncertainty in climate models, and at a nearby kiosk, begin
to learn how they personally can impact the future. An emissions calculator
offers choices of what activities each person could do to lower carbon-dioxide
levels and then shows the results of the choices; for example, if Americans
increased household vehicle efficiency by only 10 miles per gallon, carbon dioxide
emissions would drop almost 5.5 percent annually.
One particularly
sticky topic is future climate change, which is illustrated in this museum through
a sliding plasma video screen of a world map over a wall-sized graph. The exhibit
shows where and by how much temperatures and carbon dioxide levels are predicted
to rise, according to climatic models from the National Center for Atmospheric
Research and the Geophysical Fluid Dynamics Laboratory. Visitors can also examine
what leads to the uncertainty in climate models, and at a nearby kiosk, begin
to learn how they personally can impact the future. An emissions calculator
offers choices of what activities each person could do to lower carbon-dioxide
levels and then shows the results of the choices; for example, if Americans
increased household vehicle efficiency by only 10 miles per gallon, carbon dioxide
emissions would drop almost 5.5 percent annually.
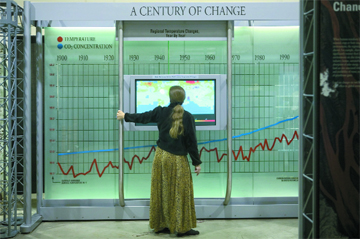
State-of-the-art sliding plasma video screens at the Marian Koshland Museum
illustrate changes in temperature and carbon dioxide levels around the world
over the past 100 years. Another sliding plasma screen shows how temperatures
and carbon dioxide levels are predicted to change over the next 100 years. Courtesy
of the Marian Koshland Science Museum.
Visitors also have the chance to be part of a live research project about what
personal tradeoffs they would be willing to make for the global good: Would
each household be willing to pay $34 more per month to save the wetlands? How
about $60 more per month to reduce emissions by 60 percent? Each visitor enters
their response and it is recorded by Pennsylvania State University researchers.
The researchers will then study individual responses to understand how to improve
public policy in light of the tradeoffs people are or are not willing to make.
Not to be outdone, the past climate change exhibit is also fascinating. Interactive
videos, posters and another sliding plasma screen show climate change from prehistoric
times to this past century, and explain how climate proxies are used to determine
what happened.
While Geotimes readers may be most interested in the climate change exhibit,
also not to be missed is the fascinating, highly interactive DNA exhibit. Visitors
use the same DNA methods the FBI uses to catch and convict a criminal, measure
their DNA against Einstein and a chimpanzee, and discover how DNA is helping
protect the public through genetic engineering of diseases and crops. “This
is high-level science that we’ve reduced to communicate in ways that are
really fun,” Koshland says.
The best pairing of people at the museum is parents with adolescents, says Bruce
Alberts, president of NAS. The parents read the information, he says, while
the kids “push the buttons” and get a lot out of the interactive portions
of the exhibits. “I just can’t imagine a better way for parents to
introduce their children to science.”
Megan Sever
MF-2396. Courtesy of the Marian Koshland Science Museum and Vicinity, Mohave County, Northwestern Arizona, by G.H. Billingsley and S.E. Graham. Prepared in cooperation with the National Park Service and Bureau of Land Management. 2003. Scale 1:31,680. One color sheet 39 x 45 inches with 27-page text. Available for $20.00 from USGS Information Services or free online.
MF-2410. ARIZONA. Geologic Map of the Upper Hurricane Wash and Vicinity, Mohave County, Northwestern Arizona, by G.H. Billingsley and H.C. Dyer. Prepared in cooperation with the National Park Service and Bureau of Land Management. 2003. Scale 1:31,680. One color sheet 38 x 44 inches with 23-page text. Available for $20.00 from USGS Information Services or free online.
MF-2418. ARIZONA. Geologic Map of Upper Clayhole Valley and Vicinity, Mohave County, Northwestern Arizona, by G.H. Billingsley and S.S. Priest. 2003. Scale 1:31,680. One color sheet 39 x 43 inches with 28-page text. Available for $20.00 from USGS Information Services or free online.
MF-2419. NEW MEXICO. Geologic Map of the Puye Quadrangle, Los Alamos, Rio Arriba, Sandoval, and Santa Fe Counties, New Mexico, by D.P. Dethier. 2003. Scale 1:24,000. One color sheet 40 x 30 inches. Available free online.
MF-2426. IDAHO and MONTANA. Geologic Map of the Bonners Ferry 30’ x 60’ Quadrangle, Idaho and Montana, by F.K. Miller and R.F. Burmester. 2003. Scale 1:100,000. One color sheet 33 x 52 inches with 31-page text. Available for $20.00 from USGS Information Services or free online.
I-2793. MARS. Topographic Map of the Margaritifer Chaos Region of Mars — MTM 500k-10/337E OMKT, by U.S. Geological Survey. Prepared for NASA. 2003. Scale 1:502,000. One color sheet 28 x 40 inches. Available for $7.00 from USGS Information Services or free online.
I-2812. CENTRAL U.S. Earthquakes in the Central United States — 1699-2002, by R.L. Wheeler, E.M. Omdahl, R.L. Dart, G.D. Wilkerson, and R.H. Bradford. Prepared in cooperation with the Central United States Earthquake Consortium and the Association of CUSEC State Geologists. 2003. Scale 1:250,000. One color sheet 57 x 43 inches. Available for $7.00 from USGS Information Services.
To order USGS maps: Contact USGS Information Services, P.O. Box 25286, Denver, Colo. 80225. Phone: 888-ASK-USGS (888/275-8747).
 |
Geotimes Home | AGI Home | Information Services | Geoscience Education | Public Policy | Programs | Publications | Careers |