Geotimes

Technology
Magnifying a Continent
Elisabeth Nadin
 EarthScope is
gearing up to outfit North America with a vast array of instruments designed
to help scientists determine the processes and pieces that make up a continent.
The endeavor aims to address the many persisting earth science puzzles that
conventional individual efforts have yet to solve — such as how earthquakes
start and how magma flows beneath active volcanoes. With access to data from
instrument networks across the country, scientists from multiple disciplines
will be able to collaborate. Now, after securing National Science Foundation
funding last September, the various EarthScope committees are moving beyond
the planning stage to implementation.
EarthScope is
gearing up to outfit North America with a vast array of instruments designed
to help scientists determine the processes and pieces that make up a continent.
The endeavor aims to address the many persisting earth science puzzles that
conventional individual efforts have yet to solve — such as how earthquakes
start and how magma flows beneath active volcanoes. With access to data from
instrument networks across the country, scientists from multiple disciplines
will be able to collaborate. Now, after securing National Science Foundation
funding last September, the various EarthScope committees are moving beyond
the planning stage to implementation.
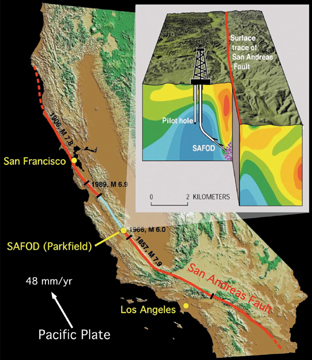
Part of EarthScope, the San Andreas Fault Observatory at Depth will monitor
activity below an active fault. Researchers drilled a 2-kilometer-deep pilot
hole in 2003 and plan to begin drilling the main hole this spring. Courtesy
of EarthScope.
“The questions that the earth science community is asking now are big,
complicated questions. And they can’t be answered with one simple discipline,”
says geophysicist David Simpson, an EarthScope facility manager. Instead, he
says that a multi-scaled investigation is necessary, and EarthScope instruments
are designed for just that. Scientists awaiting EarthScope data come from research
institutions and universities all over the country, as well as government agencies,
such as state geologic surveys and the U.S. Geological Survey (USGS).
EarthScope components are designed to reveal features of the North American
continent at different scales. At the finest scale, the San Andreas Fault Observatory
at Depth, or SAFOD, will zoom in on California’s infamous fault zone. It
will, in fact, go inside the fault zone to become the first observatory monitoring
an active fault from within, rather than from the surface. Scaling up, the Plate
Boundary Observatory (PBO) will examine the deforming U.S. West Coast and Alaska.
Zooming out again, the USArray will provide a 3-D view of the North American
continent from crust to core. And EarthScope hopes to add Interferometric Synthetic
Aperture Radar (InSAR) imagery to these three components, in order to measure
ground deformations from space. The individual EarthScope components are designed
to complement and enhance one another, so scientists will benefit from access
to several datasets teased from the four observatories. “They’d be
good by themselves, but they’re far better working together,” says
Mark Zoback, geophysics professor at Stanford University and facility manager
for SAFOD (see comment).
The challenge of EarthScope lies in erecting the whole system. Because this
is an endeavor more than 10 years in the making, the technology behind the individual
instruments in the project were conceived of long ago. Only recently, however,
has communications technology ripened to the point where EarthScope can employ
a global communications system for transferring all its data to central archives
and providing access to that data to anyone, anytime. “For the first time
we can talk about gathering data from anywhere in the United States and making
it available in real time. That certainly could not have been done 10 years
ago,” Simpson says.
Observing a fault
SAFOD scientists are already monitoring a 2-kilometer-deep pilot hole drilled
adjacent to the San Andreas Fault at Parkfield, Calif., in 2002. When spring
rains subside in May 2004, the company Therma-Source of Santa Rosa, Calif.,
will begin drilling the main hole. Although researchers will not puncture the
heart of the fault zone this summer, they will case the hole in steel, monitor
it, and finally traverse the fault zone in the summer of 2005. Eventually, SAFOD
drillers will angle the borehole to cross from the Pacific plate eastward to
the North American plate, and will then core four side holes to extract and
test materials within the active fault zone. Once the hole is finished, a steel
pipe cemented into the rock will provide a channel for the placement of sensitive
instruments within the fault zone to monitor the precise locations of fault
movement and the physical processes controlling earthquake generation. The instruments
will stand at the ready, awaiting the next big quake, Zoback says. “A year
and a day after we finish, it’ll be time for the earthquake,” he says
jokingly.
According to Stephen Hickman, a USGS geophysicist and facility manager for SAFOD,
the borehole monitoring instruments employ state-of-the-art technology that
will be tested in the pilot hole and constantly updated. The drilling team is
adapting techniques used by the oil industry, such as advanced directional drilling
methods, to target small, seismically active portions of the fault (see page
18). At various stages, a gyroscopic device lowered into the hole will provide
a 3-D view of the drill path. When the hole is complete, a seismic recording
system and sensors measuring strain, fluid pressure and temperature will locate
earthquakes with extreme precision, and monitor the behavior and physical properties
of fault zones through multiple earthquake cycles.
“We’ll set the thing up as a long-term observatory, as a sort of soda
straw into the fault zone,” Hickman says. “No one has ever drilled
through the San Andreas Fault Zone before. It will bring lots of surprises,
but that is what makes this project really exciting.”
Measuring movement
Drilling into a fault zone is an exhausting scientific endeavor on its own.
But if EarthScope hopes to achieve one of its loftier goals — to help predict
potentially damaging earthquakes — it must place the SAFOD findings in
a wider context. That is where PBO comes in. The western third of the United
States absorbs the strain imposed as the Pacific plate grinds slowly past the
North American plate. These awesome forces created the San Andreas Fault system,
and understanding them is crucial to earthquake hazard assessment.
Through PBO, EarthScope will permanently install 875 GPS receivers, 175 borehole
strainmeters and five laser strainmeters, and will provide 100 portable GPS
systems to scientists for targeted studies. These instruments will measure every
ground movement from the Rocky Mountains westward.
The borehole strainmeters are so precise, says PBO Director Mike Jackson, that
they record deformation exerted against Earth by the revolution of the moon
around it. In addition to monitoring motions associated with building stress
before an earthquake, PBO instruments will record ground-level adjustments caused
by shifting magma levels in volcanoes.
And, says Nancy King, a geophysicist with USGS, PBO is likely to reveal unexpected
movements. Before joining the PBO team, King oversaw the day-to-day running
of the 250-station Southern California Integrated GPS Network (SCIGN). She says
that the SCIGN data surprised scientists by revealing deformation caused by
water pumping and withdrawal.
King’s experience with the logistics of setting up SCIGN will likely prove
useful as PBO launches into action. The first step is to convince landowners
to host the instruments. “We were very naïve about how long it was
going to take to get some of these permits [for SCIGN],” King says. “I
think the scientific goals are great. But it’s easy to underestimate the
logistical difficulties. We did.”
In addition to permitting, PBO planning demands flexibility in outfitting each
specific site.
Researchers will anchor GPS antennas on 30- to 40-foot-deep drilled monuments.
The instruments run off power from solar panels, but sites in the cloudy Pacific
Northwest may need auxiliary power. Transferring data from most sites via satellites,
wireless internet or radio modem is run of the mill these days; but getting
data from remote sites like the Alaskan interior will require some ingenuity.
Still, Jackson says he isn’t worried. “We’re ready to hit the
ground running,” he says. He has obtained permits for almost half of the
50 PBO sites scheduled for this year and hopes data will begin flowing from
those sites by December.
Seeing the continent
Just as PBO seeks permission to begin installing sites, USArray faces similar
challenges at a larger scale. Its aim is to create a 3-D picture of the underpinnings
of the North American continent by recording vibrations transmitted through
the United States from earthquakes around the world. By monitoring the arrival
times of ground vibrations, scientists can differentiate old, cold pieces of
the crust and underlying mantle from young, hot pieces. USArray data will also
help scientists explore Earth’s core and magnetic structure. Scientists
hope the seismic data will provide insight into how faults start and grow and
eventually link together.
The backbone of the USArray network consists of 40 reference stations that will
be added to the existing Advanced National Seismic System run by USGS (Geotimes,
October 2003). These permanent stations will be augmented with observations
from 400 portable seismometers, which will cover the United States one swath
at a time, recording in a location for up to two years before moving to the
next. In effect, 400 roving instruments will accrue the equivalent data of 2,000
stations over the next 10 years. This array will provide good resolution from
the deep crust to the core. The task of filling in the blanks near Earth’s
surface then lies with the flexible array, a pool of 2,400 portable instruments
for high-density, shorter-term observations. By the end of 2004, USArray should
have its first group of instruments assembled, and deployment will begin on
the West Coast.
Nadin is a freelance science
writer and a graduate student in geology at Caltech.
Links:
"Earthquake warning
tools," Josh Chamot, Geotimes, October 2003
"Earthquake Prediction and the Developing World,"
Mark Zoback, Geotimes, March 2004
"EarthScope:
Reassembling a continent in motion," Gregory van der Vink for the EarthScope
Working Group and steering committees, Geotimes, April 2002
Back to top
