
 Volcanic
eruptions are one of the great events of nature. They unfold on their own timescales,
in their own manner, and often profoundly affect the surrounding landscape.
When volcanoes are in repose, we do not know when they will erupt next, and
when they do erupt, we do not know when they will quiet down. As they reawaken,
we must wait to determine whether we are witnessing some temporary volcanic
readjustment or the final push of magma to the surface. Between eruption and
quiescence, we have a volcano’s history to guide us, but not to tell us
what is around the next corner. It is not that scientists do not know much about
volcanoes, but rather that volcanic systems are complex and difficult to study
directly.
Volcanic
eruptions are one of the great events of nature. They unfold on their own timescales,
in their own manner, and often profoundly affect the surrounding landscape.
When volcanoes are in repose, we do not know when they will erupt next, and
when they do erupt, we do not know when they will quiet down. As they reawaken,
we must wait to determine whether we are witnessing some temporary volcanic
readjustment or the final push of magma to the surface. Between eruption and
quiescence, we have a volcano’s history to guide us, but not to tell us
what is around the next corner. It is not that scientists do not know much about
volcanoes, but rather that volcanic systems are complex and difficult to study
directly.
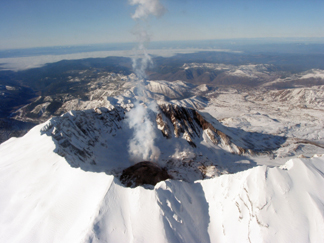
Mount St. Helens in Washington, shown
here on Jan. 3 looking to the northwest over the crater rim with a new dome
steaming, reawoke last September, nearly 20 years after its last volcanic activity.
Since then, scientists have been monitoring the volcano to forecast what happens
next. Photo by Ken McGee/USGS.
If asked at this time last year, most volcanologists familiar with the volcanoes
of the Pacific Northwest would have said that Mount St. Helens in Washington
was the volcano most likely to erupt next in the Cascades. Mount St. Helens,
which erupts frequently, has remained the most seismically active of the Cascade
volcanoes since the end of its last eruption in 1986. And worldwide, there are
few volcanoes that retain a deep-seated amphitheater like Mount St. Helens’,
left over from a landslide from the May 18, 1980, eruption, for very long.
Nonetheless, when the volcano began its path to eruption on Sept. 23, many volcanologists,
including myself and others at the U.S. Geological Survey’s Cascades Volcano
Observatory (CVO), were completely surprised.
Looking for signs
Although the precise course of volcanic activity is difficult to predict, volcanologists
are pretty adept at interpreting volcanic signals from well-monitored volcanoes
in order to make short-term forecasts. As magma moves from depth, it breaks
a new pathway to the surface. As it nears the surface, gases within the magma
form bubbles and escape due to the decrease in pressure. Accumulation or withdrawal
of magma can cause volume changes within the crust. Various monitoring tools
record these effects to give us warning before eruptions, changes in eruptive
behavior during eruptions, or signals that an eruption is ending. Foremost among
these tools is seismic monitoring. The character, size, depth and rate of earthquakes
are all important to the interpretation of what is happening belowground.
During volcanic unrest prior to an eruption, the presence of moderate to large
quantities of magmatic gases (carbon dioxide, sulfur dioxide and hydrogen sulfide)
is a pretty clear indication that magma is the cause of the unrest, not tectonic
forces or changes in the volcano’s hydrothermal system. Which gases are
present can give scientists an idea of how close magma is to the surface, and
the amount can tell them the likelihood of an explosive eruption. A decrease
in gas flux through time is an indication that an eruption may be ending.
Another important indicator is changes in the shape of a volcanic edifice. Such
deformation can indicate where magma is being stored and from where it is being
withdrawn. When magma breaks to the surface, deformation monitoring tools can
show how fast the lava is moving and in what direction. In the past, monitoring
the changing shape of volcanoes was labor intensive and generally only a few
data points were made in a day. Now with Global Positioning System (GPS) networks,
hundreds to thousands of data points per site are recorded daily, depending
on the sampling rate. Such data have been key to our monitoring of Mount St.
Helens since it began its eruption more than five months ago.
A reawakening
The first inkling of renewed activity at Mount St. Helens began in the early
hours of Sept. 23, when a seismic swarm — tens to hundreds of earthquakes
over days to a week — began beneath the volcano. Seismic swarms at Mount
St. Helens were not new, and the staffs at CVO and the University of Washington’s
Pacific Northwest Seismograph Network (PNSN) had seen many at the volcano, sometimes
several per year, since the end of the 1980-1986 eruption. Thus, the seismicity
was of interest, but not particularly out of the ordinary.
The following day, we at CVO and PNSN, after a brief consultation with the Gifford
Pinchot National Forest (which manages land at Mount St. Helens) and the Washington
Emergency Management Division, issued an “Information Statement.”
The statement told the public and public officials that a shallow (less than
2 kilometers) swarm of small earthquakes (less than magnitude-1.2) similar to
one that occurred in November 2001 was occurring beneath Mount St. Helens. Although
we did not know the cause of the swarm, we suggested that it might reflect increased
groundwater levels with the onset of the autumn rains, which had occurred earlier
than usual. Based on past history, we suggested that the swarm would be over
in a day or two. The Information Statement appeared to have the same effect
that all of the past ones had: Shortly after it was issued, the number of earthquakes
began to decline and it looked like the swarm would fizzle out.
Midafternoon on Saturday the 25th, however, a magnitude-2 earthquake occurred
beneath the volcano, followed by another one several hours later. Over the next
24 hours, about a dozen magnitude-2 to 2.8 earthquakes occurred. This was the
greatest number of earthquakes larger than magnitude 2 that had occurred at
Mount St. Helens in a 24-hour period since the end of dome growth in October
1986, and was the first unambiguous signal of unusual activity at the volcano.
The following morning, we issued a “Notice of Volcanic Unrest,” the
first of a three-tiered alert-level system, to indicate that activity at the
volcano was above normal background levels. At the time, the cause of the unrest
and whether it would culminate in an eruption were unknown. It was the first
time since the end of the 1980-1986 Mount St. Helens eruption that a Cascades
volcano had reached this alert level.
On Monday the 27th, CVO field crews flew to the volcano to add additional GPS
instruments on its flanks and to fix a GPS station in its crater. Other crews
made visual observations and measured the atmosphere for the presence of volcanic
gases. No magmatic gases or deformation were detected, but there was a hint
of an unusual fracture pattern in the glacier ice on the south side of the 1980-1986
lava dome.
By Sept. 29, earthquakes as large as magnitude 2.5 were occurring at a rate
of four per minute. This prompted us to raise the volcano’s status to a
“Volcano Advisory.” The high earthquake rate and hint of deformation
indicated that magma was the source of the unrest and that an eruption was likely,
but not guaranteed. There were still no anomalous gas measurements or movements
of the broader volcanic edifice. With the increase in alert level, CVO went
on 24-hour watch and media and public interest scaled accordingly. In the span
of less than a week, we had gone from volcanic repose to volcanic crisis.
Volcanic crisis
 At volcanoes
such as Mount St. Helens that have a wide range in eruptive style and size,
the beginning of a volcanic crisis is especially tense because of the many uncertainties
regarding if, or when, an eruption will occur. Although we have many tools to
detect volcanic unrest, these tools measure the effects of magma movement, not
the magma itself. Thus, when unrest begins, we do not know if an eruption will
occur, or if one does, when it will begin, how big it will be, and whether it
will be explosive or effusive. These questions are important, especially as
eruption style and size determine the hazards involved.
At volcanoes
such as Mount St. Helens that have a wide range in eruptive style and size,
the beginning of a volcanic crisis is especially tense because of the many uncertainties
regarding if, or when, an eruption will occur. Although we have many tools to
detect volcanic unrest, these tools measure the effects of magma movement, not
the magma itself. Thus, when unrest begins, we do not know if an eruption will
occur, or if one does, when it will begin, how big it will be, and whether it
will be explosive or effusive. These questions are important, especially as
eruption style and size determine the hazards involved.
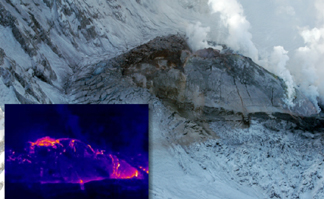
A new lava dome, shown here on Nov. 20,
emerged at Mount St. Helens starting in October. The FLIR — Forward-Looking
InfraRed — image (inset) shows the heat of the new dome, ranging from 450
degrees Celsius to ambient temperatures. Hotter temperatures are pink to white,
and cooler temperatures are blue. Courtesy of USGS.
The challenge during periods of unrest is not only to determine when and what
is likely to happen on the basis of the monitoring data, but also to communicate
all the inherent uncertainties of these interpretations to public officials
and the public in a meaningful and useful way. By the end of the first week,
the science staff at CVO and PNSN began to hold daily morning conference calls.
The meetings provided a forum for quick dissemination of monitoring data and
also an opportunity to discuss the implications of the data in the context of
past eruptions at Mount St. Helens and at similar volcanoes worldwide. During
these meetings, we would work to reach a consensus regarding the most likely
outcomes to convey to public officials and the media, and we would also discuss
future monitoring strategies.
Seismic activity at Mount St. Helens continued to increase, and on Oct. 1, an
explosive steam-and-ash emission began around noon. The vent for the explosion
was in the area of now obvious deformation on the south side of the lava dome
and adjacent glacier. Fortuitously, a field crew was circling the crater with
a Forward Looking InfraRed (FLIR) instrument mounted on a helicopter when the
explosion began. On loan from the Alaska Volcano Observatory, the FLIR is a
thermal imaging device that we were using to look for evidence of hot material
intruding into the old lava dome. Within minutes of the explosion’s start,
we learned that the steam-and-ash plume was relatively cold. Magma had not yet
reached the surface. Unfortunately, the explosion destroyed the only seismic
and GPS stations in the crater.
Over the next five days, four more explosive steam-and-ash emissions occurred.
What was interesting about these events was that the size, rate and character
of the seismicity did not change before or during them; it was as if the volcano
was unaware that the emissions were occurring. Shortly after it was over, however,
earthquake size and rate decreased markedly and stayed low for several hours
before building back up to previous levels. Also during this time, a new seismic
signal appeared — tremor — that had been rare since the end of the
1980-1986 eruption.
On Oct. 2, shortly before Secretary of the Interior Gale Norton was due to fly
over the volcano and then visit CVO, a 55-minute episode of intense tremor had
scientists concerned that an explosive eruption would occur soon. CVO raised
the alert level to the highest level, “Volcanic Alert,” indicating
that a hazardous eruption was imminent or under way.
After the last and largest steam-and-ash explosion, the energy level decreased
dramatically and remained at low to moderate levels. Would the volcano return
to quiescence without the appearance of magma? Although seismicity had declined,
deformation along the south margin of the 1980-1986 dome and adjacent glacier
continued, and carbon dioxide was being detected in the crater. Data from the
FLIR indicated increasing temperatures in the deforming area, but nothing yet
to indicate that magma had reached the surface.
Luckily, the weather during late September and early to mid-October was beautiful,
allowing us time to install new instruments and make sure that those already
in the field were ready for the winter months ahead. We were also able to view
the crater area on many successive days, which allowed us to visually monitor
the deformation of the glacier and south margin of the old dome, as this deformation
did not show up on GPS stations on the outer flanks. If the weather had been
poor, we would not have known much about the crater deformation, nor would we
have been able to do thermal imaging or look for magmatic gases. In fact, we
may have totally missed the steam-and-ash emissions and would have been left
to guess why the sudden drops in seismic energy occurred.
The good weather also led to greater public and media engagement. The increased
Internet traffic to CVO, PNSN and the U.S. Forest Service Web sites, along with
the number of people who personally came out to view the volcano, made this
truly everyone’s event.
Emerging dome
 The wait to
determine whether the unrest was waning or waxing was brief. On Oct. 11, field
crews glimpsed a new rock mass through the steam in the northwest corner of
the deforming area. FLIR measurements showed temperatures between 500 and 600
degrees Celsius, confirming that magma had indeed reached the surface. Nighttime
images taken by a local television station showed incandescent material in the
crater, further confirming that magma had reached the surface. The eruption
had begun.
The wait to
determine whether the unrest was waning or waxing was brief. On Oct. 11, field
crews glimpsed a new rock mass through the steam in the northwest corner of
the deforming area. FLIR measurements showed temperatures between 500 and 600
degrees Celsius, confirming that magma had indeed reached the surface. Nighttime
images taken by a local television station showed incandescent material in the
crater, further confirming that magma had reached the surface. The eruption
had begun.
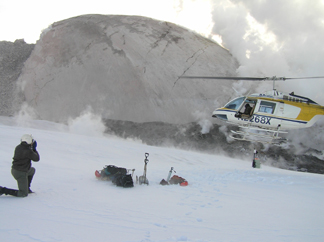
On Jan. 14, U.S. Geological Survey scientist John Pallister photographed deployment
of a video camera and gas-sensing “spyder” into Mount St. Helens’
crater, with the new dome in the background. Image courtesy of USGS.
The extrusion of lava onto the surface was, and has remained as of Feb. 15,
a relatively quiet and constant event. Most earthquakes associated with the
extrusion have been less than magnitude 1.5, occurring at fairly regular intervals
of tens of seconds apart. At times, the character, interval and waveform of
the earthquakes have been nearly identical for days at a time, while at others,
there has been greater variety. The meaning of these subtle changes in not entirely
known.
Although local deformation continues with the extrusion, there has been little
deformation registered at the GPS network on the flank or on stations at greater
distances. The volume change of the new rock and deformed area have also been
remarkably uniform through time, between about 2 and 5 cubic meters per second
since Oct. 11. And magmatic gas emission rates have been remarkably constant,
at about 150 metric tons per day of sulfur dioxide, 1,000 metric tons per day
of carbon dioxide and less than 5 metric tons per day of hydrogen sulfide.
Rocks collected from the dome tell us that in the 18 years between the creation
of the new and old lava domes, the lava has become more silicic and that we
are not just seeing the simple evolution of the 1980s magma. The carapace of
the new dome is made of a meter or more of crushed new rock, which is very unusual
compared to the dome extrusion in the 1980s and at other volcanoes worldwide.
How the volcano quietly pushes out crystal-rich rock at a nearly constant rate
for months continues to be a topic of scientific debate.
Ironically, once the eruption began, many of the external pressures on the scientists
began to diminish. The weather shifted back to a more normal Pacific Northwest
weather pattern of days of clouds and rain, briefly interrupted by a day or
two of clear weather. With the poorer weather, the camera crews packed up and
left the mountain.
Once it was established that the lava was relatively gas poor and the probability
of a large explosive eruption was small, the need for frequent communications
with emergency and land managers decreased as well. But even though many in
the public perceived that the eruption was over, it was not; the monitoring
has continued for us scientists, as well as for land and emergency managers.
One of the many challenges to monitoring this eruption has been its timing.
A concern from the very beginning was how to monitor the volcano during the
poor weather and short days of the winter months. Another concern was getting
instruments into the crater without endangering field crews.
One of the innovations from the eruption is the bundling of primarily seismic
and GPS sensors into packages that could be slung in by helicopter and lowered
onto the dome, the deforming area or wherever needed in the crater. Batteries
and radios in the bundled devices allow data to be telemetered back to the observatory,
to limit the exposure of field crews who would otherwise need to visit the sites
to download the data. A requirement for these packages was that they be relatively
inexpensive, as their survival rate in such an environment was likely to be
low.
After an early package (essentially a tool box with mounted antennas and a GPS
sensor outside and batteries and radios inside) fell over on uneven ground,
three legs were welded onto the trunks for stability. With this modification,
“spyders” (they spy) were born. About a dozen have been deployed to
date, with a loss of four. Three of the four lost spyders were placed on the
new lava dome and recorded sometimes short, but always interesting, rides.
The end of an eruption is as difficult to predict as the beginning of one, but
it is equally important. During eruptions, scientists and public officials need
to be concerned foremost with public safety. As long as an eruption is in progress,
the situation is inherently unstable, and safety corridors need to be established.
This constant vigilance takes energy and resources. Once the eruption is over,
these energies can be rerouted elsewhere, and the public can again enjoy the
landscape. For scientists, the end of the eruption will be the close of a fascinating
chapter, but the data acquired will be the beginning of new chapters in understanding
volcanoes and their eruptions.
|
New
monitoring at Montserrat “Can we predict when the volcano is next going to erupt? That’s the $64,000 question,” says Glen Mattioli, a volcanologist at the University of Arkansas in Fayetteville. On Soufrière Hills volcano on the Caribbean island of Montserrat, Mattioli and colleagues are one step closer to predicting when lava will next erupt, he says, thanks to a sensitive system of monitoring instruments known as CALIPSO, the Caribbean Andesite Lava Island Precision Seismo-geodetic Observatory. Since early 2003 when CALIPSO was installed deep inside the walls of Soufrière Hills, volcanologists have been poised to catch any rumblings of activity within the volcano, which has been erupting intermittently for a decade. On July 12, 2003, they got that opportunity when the volcano roared to life with a lava dome collapse that produced a series of ash and rock flows and explosions, as well as a tsunami. The international team of researchers is still analyzing data from that eruption, but in the meantime is working on models to figure out when the next big event will happen. The CALIPSO system features four boreholes, each 200 meters deep and about 11 centimeters in diameter, spaced at different intervals and locations around the mountain. Within each borehole is a series of three instruments — seismometers, tiltmeters and strainmeters. These instruments, along with GPS units at the surface, are designed to record any ground motions associated with the volcano, Mattioli says. “Each instrument has a different sensitivity,” he says, allowing the researchers to get a glimpse of the volcano’s “plumbing system.” While “the monitoring system deployed at Montserrat is not unique in the types of instruments deployed,” says Michael Hamburger, a geologist at Indiana University in Bloomington, CALIPSO is unusual in its density of sensitive observing instruments. Having such instrumentation in the near-field of an active volcano, he says, “permits detection of extremely small volcanogenic signals.” Before, during and after the July 12 eruption, CALIPSO did record a lot of signals that the researchers had never seen before, Mattioli says, such as a strain signal that occurred with the pyroclastic flows that generated the tsunami waves. “The instruments sensed even small changes in the ocean load, which tells us that even small pyroclastic flows can excite the ocean and generate a tsunami,” he says. Collecting data over the past two years has helped the researchers find characteristic patterns of eruptions at Soufrière Hills, which they hope will help them figure out what will happen next. Currently, Mattioli says, the edifice is continuing to inflate. That and other clues make the scientists “fairly confident that this will start extruding lava soon,” he says. However, while the researchers will be able to tell that something is going to happen, they cannot yet predict exactly how the lava will manifest itself. That’s the conundrum scientists at Mount St. Helens and elsewhere are running into, Mattioli says (see main story). Scientists knew that “something was going to happen, but they could not say what.” Systems of instruments like CALIPSO could help pin down the possibilities, he says, but until volcanologists can completely understand the rock development and magma dynamics for variety of volcanic systems, they are not going to be able to predict just what will happen and when. The other problem, Hamburger says, is the cost associated with such a sophisticated program and the practicality of drilling active volcanoes. At many active volcanoes around the world, “the steep slopes, physical inaccessibility, legal or political barriers, and hazards to volcanologists make it impossible to consider deployment of such a system,” he says. Nonetheless, the presence of volcano-monitoring systems like that deployed at Montserrat is very important, Hamburger says, especially for coastal communities at risk from tsunamis caused by volcanic eruptions, or earthquakes and landslides associated with the eruptions. Megan Sever |
 |
Geotimes Home | AGI Home | Information Services | Geoscience Education | Public Policy | Programs | Publications | Careers |