|
 Subscribe

FEATURE
Down with the Dams: Unchaining U.S. Rivers
Jim O’Connor, Jon Major and Gordon Grant
Oregon’s Marmot Dam serves as an experiment, showing what can happen when a large dam is removed from a river.
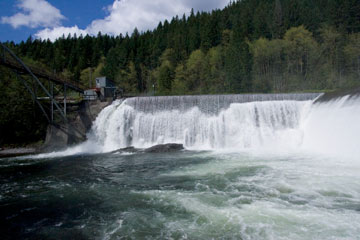 Courtesy of Portland General Electric |
| For more than 90 years, Marmot Dam blocked the Sandy River in Oregon, providing hydroelectric power, as well as recreational activities on the lake that formed behind the dam. |
More than anything else, dams have changed the fluvial landscape of the United States. Dams interrupt and change the flow of rivers, as well as the movement of sediment, nutrients, organic materials and aquatic organisms. Nearly 80,000 large dams — those exceeding 7.6 meters high, storing more than 61,615 cubic meters of water behind them or those posing a significant hazard if they fail — have been constructed for hydropower, water supply and flood control since European settlement of North America, according to the U.S. Army Corps of Engineers National Dam Inventory. As former Secretary of the Interior Bruce Babbitt once noted, this equates to nearly a dam a day since the signing of the Declaration of Independence. The “golden age” of U.S. dam building peaked in the 1960s, when more than five large dams per day were completed, including many of the largest, such as Glen Canyon Dam on the Colorado River. The end result of this massive manipulation of the fluvial system has been the fragmentation of almost every large river in the country.
In recent years, however, there has been a growing reversal — only a trickle at first, but now a steady stream of dams are being removed. The American Rivers organization has documented approximately 750 dam decommissionings since 1912, with the pace picking up to between 20 and 50 each year for the last 10 years. Currently in the United States, more dams are being removed than built.
The Impetus
Although still less than 1 percent of all dams, these removals constitute a change in thinking in human intervention of fluvial landscapes. Motivating these removals is a complex constellation of politics, economics and safety issues, as well as increasing recognition of the mostly unintended consequences of interrupting river ecosystems. Two factors in particular have captured the public eye: high-visibility cases such as the Colorado River in Grand Canyon National Park, where Glen Canyon Dam and other upstream dams have significantly affected renowned aquatic, cultural and recreational resources; and perhaps most importantly, the hundreds of nonfederal hydropower dams that have undergone or are presently undergoing relicensing under the auspices of the Federal Energy Regulatory Commission (FERC).
For these dams, the original 30- to 50-year FERC licenses are expiring after the pulse of dam building during the 1950s through 1970s. The relicensing process requires examination of the public interest of continued dam operation and hydropower generation in light of changing environmental and cultural values. In 1994, FERC stated that decommissioning was a potential outcome of the relicensing process, and first took this path in 1998 when FERC denied a new operating license for the Edwards Dam on the Kennebec River in Maine. The 1999 removal of the Edwards Dam was notable for opening up fish passage, but this high visibility removal also spawned heightened awareness of a new socio-politico-scientific endeavor: dam removal.
The Issues
Dam removal, however, is complicated. Many dams slated for removal have been in place for decades, and the surrounding physical, biological and social systems have adjusted in some manner to each dam’s presence. Sports fisheries, recreation, water supply and downstream flow conditions can all be significantly affected. Additionally, the actual removal of the dam itself is a profound geomorphic and ecologic disturbance that will propagate upstream and downstream through a host of uncertain processes.
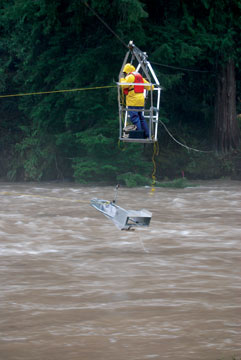 U.S. Geological Survey |
| Researchers measured the flow of water and sediment both before and after Marmot Dam was breached in 2007. |
The fate of the previously sequestered sediment (and possible contaminants) is a major issue, and commonly drives decisions regarding dam removal. Existing science is of little help; few studies guide our understanding of the physical and ecologic consequences of dam removal, forcing decision-makers and resource managers to deal with uncertain outcomes. Even if there is broad agreement to remove a dam, actual decommissioning can take years, owing to multifaceted decision-making processes, in addition to federal, state and local laws and regulations.
These complications are especially evident in the Pacific Northwest, where many dams are targeted for removal. Here, it is mostly about fish. In the Columbia River Basin, for example, approximately a third of the river habitat once reached by fish that migrate upriver to spawn has been completely blocked by dams, and passage difficulties and degraded habitat contribute to drastically reduced fish runs even where passage facilities exist.
As a consequence, over the last decade, dozens of small dams have been removed in Oregon, Washington and Idaho, mainly to promote fish access to severed habitats. Most of these removals involved small and remote structures that no longer functioned as originally intended, and their removal attracted little fanfare or notice. As the movement has swelled, however, more controversial and complicated removals are now on the table, including the planned removal of larger hydropower or irrigation dams on the Elwha, Rogue, Sprague, White Salmon and Clark Fork rivers. More controversial discussions have waxed and waned, mostly in political arenas, regarding even larger dams on the Klamath and Snake rivers.
A Pacific Northwest Experiment
Incorporating all these attributes of complexity and controversy, the Marmot Dam on the Sandy River in northwestern Oregon, a scenic mountain river just east of the Portland metropolitan area, was one of the first significant hydropower dams to be removed in the Pacific Northwest. This concrete diversion dam, first completed in 1913, stood 14.3 meters tall and stretched 50 meters across the Sandy River, about 45 kilometers upstream of the Sandy River confluence with the Columbia River. The pool behind the dam extended about 1,800 meters upstream and was completely filled with about 750,000 cubic meters of sand and gravel. Marmot Dam was the only dam on the Sandy River, a sand- and gravel-bed river that drains about 1,300 square kilometers of the western Cascade Range in northern Oregon, including the southern and western flanks of Mount Hood volcano.
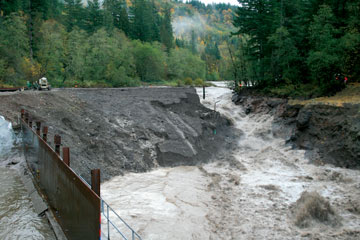 U.S. Geological Survey |
| To enable removal of the concrete Marmot Dam, Portland General Electric built a temporary earthen dam just upstream to divert the flow around the dam in summer 2007. With the concrete dam removed, the earthen dam was allowed to breach with autumn's first high flow. |
The Sandy River is sediment rich, mainly because of its Mount Hood headwaters, where Late Quaternary glaciation and volcanism have supplied large volumes of coarse sand and gravel. The Sandy River also hosts highly valued fish, including multiple runs of Chinook and coho salmon and steelhead and coastal cutthroat trout. Winter steelhead, spring and fall Chinook, and coho are listed as “threatened” under the Endangered Species Act.
In October 2002, facing a pending November 2004 expiration of its FERC license and prohibitive costs for future maintenance as well as upgrading fish passage around two dams, Portland General Electric (PGE) announced it would decommission its 22-megawatt Bull Run Hydroelectric Project. That would include the removal of Marmot Dam in 2007 and a smaller structure on the Little Sandy River in 2008.
While there was broad agreement that these removals were the best option at many levels — most importantly, they open 10 kilometers of completely blocked fish habitat on the Little Sandy River and improve access to an additional 160 kilometers of Sandy River habitat upstream of Marmot Dam — tense moments ensued. Divisive issues included the fate of the small lake with heavy recreational use that depended on the project diversions for its water supply; addressing the dam’s function of separating wild and hatchery stocks of salmon and steelhead in the river; and perhaps most difficult, how to handle the 750,000 cubic meters of sand and gravel accumulated behind Marmot Dam.
In the end, PGE opted, with consensus from 23 environmental, federal, state and local agencies, to proceed with rapid dam removal with minimal sediment removal — the so-called “blow and go” alternative. This option had the important upsides of low cost and minimal in-channel work activities that might disturb fish. The main downside was the uncertain consequence of providing an energetic river unfettered access to approximately 730,000 cubic meters of sand and gravel.
The sediment issue prompted multiple studies and even more speculation. Concerns were raised early about the possibility of downstream sediment movement directly impacting fish, and indirectly affecting them by burying or isolating spawning and rearing habitats, especially deep pools and side channels. Questions abounded: What might be the magnitude, duration and spatial distribution of such effects, especially as they pertained to critical fish habitat? How fast might a knickpoint (an abrupt change in channel slope), if formed, migrate upstream? And what would be the consequences of such a migration? Could such a knickpoint block fish passage? How fast would the reservoir sediment evacuate? Could the sediment accumulations be stabilized in order to avoid long-term turbidity issues? Physical- and numerical-modeling studies hinted at what might come.
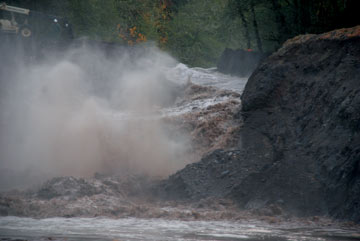 Courtesy of Portland General Electric |
| The river washed away the earthen dam in a matter of hours. |
Numerical modeling by PGE consultant Stillwater Sciences indicated rapid sand movement down the river, with perhaps up to 0.4 meters of channel filling as far downstream as where the Sandy River meets the Columbia River within the first year. Coarse sediment — gravel — was predicted to move more slowly and not as far, and in fact, 30 kilometers from the dam was predicted to be indistinguishable from normal gravel transport and deposition. In the reservoir, both the numerical and physical models predicted rapid upstream movement of the knickpoint, but with perhaps as long as two years for the river to incise halfway down through the total thickness of reservoir sediment.
These modeling results were, of course, contingent on the actual flows in the days, months and years after removal. But confidence in these results was limited by the sparse empirical data for these kinds of scenarios: There have been no well-monitored dam removals in which such a vigorous river has been set loose on this large a volume of readily mobilized sediment.
In light of these questions, the removal of Marmot Dam became an unprecedented experiment, one that attracted a diverse group of researchers from various institutions, including government agencies, universities and private businesses. Pooling scarce resources (but with significant support from PGE), this group developed a plan to document the dam removal and its effects on the fluvial system over the next several years.
 Kurt Spicer, U.S. Geological Survey |
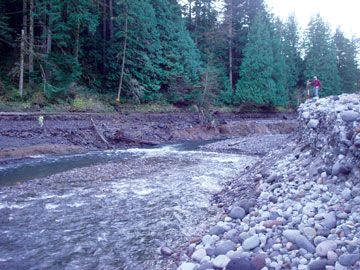
| The Sandy River now freely flows from its headwaters in the Cascades to its confluence with the Columbia River and on out to the Pacific Ocean. |
This experiment had many facets, all reflecting our goal to have some answers to the questions posed above before the next decommissioning. Long-term year-to-year changes to the former reservoir and downstream channel (and fish habitat) are being monitored by repeat surveys of cross sections and the river profile upstream and downstream of the dam, aided by repeated high-resolution measurements of topography using Light Detection and Ranging remote sensing (LiDAR) and aerial photography. We’ve also mapped channel geometry and the distribution of grain sizes in downstream reaches, so that repeat measurements this summer will document changes in channel and aquatic habitat conditions. We also anticipated that much of the action, including erosion of the reservoir sediment and downstream sediment movement, would be during this winter’s first high flow events, so we established flow and sediment-gauging stations upstream and downstream of the dam for measuring bedload and suspended load transport, camera stations to obtain time-lapse photography of the reservoir to document rates and processes of sediment evacuation, and a program of repeat soundings from cableway and bridge crossings to document short-term changes in channel shape.
So … What Happened?
Despite our planning, we weren’t quite sure what to expect at the time of actual breaching and release of the impounded sediment. Part of this uncertainty was due to the nature of the removal process. PGE removed Marmot Dam by first building an earthen coffer dam 70 meters upstream from the concrete structure and diverting the summer low flows around and back into the Sandy River channel just downstream of the existing dam. This allowed them to drain the coffer dam and underlying sediment, remove the sediment between the coffer dam and the concrete structure, and then demolish and remove Marmot Dam.
This was completed between July 1 and Sept. 30, 2007, with the plan that the coffer dam would be breached after the late summer upstream salmon migration and during the first significant fall runoff event. PGE wanted a significant flow in conjunction with initial breaching so that the resulting knickpoint would move upstream and erode sufficiently so as not to block fish passage. But, there was also the constraint that the diversion channel could safely pass only about 60 cubic meters per second of flow. So in the end, the success of our planned breach observations and sediment and flow measurements became a matter of watching the weather and the flows and being ready to quickly get to the river.
After a few early season rainstorms accelerated our preparations, the first major fall storm compelled PGE to start the breach process on the rainy Friday morning of Oct. 19. After turning off the pumps that dewatered the temporary earthen dam, seepage through the coffer dam quickly triggered small failures of the downstream face, but the notching (small cuts to allow water to begin flowing), which began at 5 p.m., allowed the water behind the dam to overtop and start incising through the coffer dam.
Violent erosion of the dam quickly followed over the next 45 minutes, increasing flow at a U.S. Geological Survey (USGS) stream-gauging station 500 meters downstream from less than 30 cubic meters per second to nearly 140 cubic meters per second as the small volume of stored water rapidly exited through the breached dam. A knickpoint formed at the breach and quickly migrated 150 meters upstream. Within several hours, the entire coffer dam had eroded away; by morning, a large bar had formed just downstream, the knickpoint had migrated another 250 meters upstream and lateral channel shifting was rapidly eroding the sand and gravel reservoir deposits — at surprisingly fast rates. Erosion of the dam and reservoir sediment is documented by the stationary camera network, with time-lapse sequences available for viewing at vulcan.wr.usgs.gov/Projects/MarmotDam/framework.html.
At the USGS stream-gauging station just downstream, we monitored and sampled through the weekend following the breach. By the end of the first weekend, perhaps 15 percent of the sediment behind the former dam had been eroded and moved downstream, much of it deposited in a sediment wedge up to four meters thick and extending more than a kilometer downstream from the former dam location.
Months later, we still marvel at the pace and form of changes to the local fluvial landscape. By late December 2007, three significant flow events since the breach had eroded even more reservoir sediment and moved sand and gravel farther downstream. At that time, the knickpoint was nearly a kilometer upstream and barely perceptible. Gravel from the reservoir had apparently moved at least 10 kilometers downstream, and sand another 10 kilometers. More extensive surveys at low water next summer will better define the spatial distribution of sand and gravel transportation and storage driven by the first season of stormflows.
These initial surveys and measurements, as well as those that will follow in the years to come, will ultimately document how rivers respond to such sediment pulses and what the consequences may be to resources such as fish and their habitats. These observations will also enable better understanding (and predictions) of the consequences of the ever-expanding list of future dam removals in the Pacific Northwest and elsewhere. For most of these questions, we’re still too early in the measurement process to provide answers. But as we continue our documentation of this remarkable experiment, we already see people fishing, and the morning after the breach, we saw kayakers run a stretch of the Sandy River that hadn’t been navigated in nearly a century.
A Changing Landscape
Most cataclysmic landscape change results from processes largely outside of human control — earthquakes, volcanism and most landslides, to name a few — and a key role of earth scientists is to understand such processes so that society can better manage hazards and their impacts. Dam removal is different in that there is more potential for controlling the processes, because we decide when, how and where. But with that control comes responsibility. For this reason, it is imperative that the geologic and ecologic consequences of dam removal be well understood as society commences on this bold new mission of reconnecting river ecosystems. Studies such as those at Marmot Dam and elsewhere are a start, but we still have much to learn as more and more long-restrained rivers shake off their shackles.
Links:
Marmot Dam Breach, Sandy River, Oregon
October 19, 2007 (USGS)
Marmot Dam Decommissioning
"Breaking Down Dams," Geotimes, September 2004