WHAT WE'VE LEARNED
by Robert I. Tilling
| Geotimes Home | Calendar | Classifieds | Advertise | Subscribe |
| Geotimes
Published by the American Geological Institute |
News
and Trends in the Geosciences
May 2000 |
| MOUNT
ST. HELENS 20 YEARS LATER:
WHAT WE'VE LEARNED by Robert I. Tilling |
|
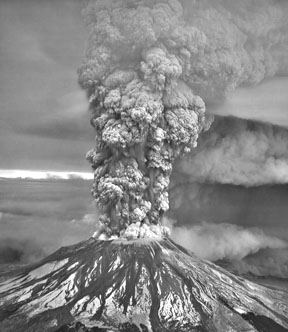
Twenty years
ago in late March, southwestern Washingtons Mount St. Helens, a volcano
in the Cascade Range, awoke from its 123-year slumber. Following two months
of precursory activity including sustained energetic seismicity,
phreatic explosions and rapid deformation (bulging) of its north flank
from magmatic intrusion Mount St. Helens erupted cataclysmically on the
morning of May 18 when its north flank collapsed.
This eruption caused the worst volcanic disaster in the recorded history of the United States, resulting in 57 deaths, scores of injuries and economic loss exceeding $1 billion. However, because it was thoroughly documented and received intense media attention worldwide, the eruption and its aftermath have also proved a boon for the geosciences especially for the study of volcanoes.
Modern volcanologic studies began early in the 20th century, in large part reflecting the scientific and societal need to better understand how volcanoes work in the wake of three 1902 eruptions that claimed more than 36,000 lives: Mont Pelée, Martinique; Soufrière, St. Vincent; and Santa María, Guatemala. In a similar way, the 1980 Mount St. Helens eruption ushered in two decades of heightened public awareness and significantly expanded scientific studies of eruptive phenomena and associated volcano hazards. It has proved a veritable renaissance in the science of volcanology that continues into this century.
The reawakening of Mount St. Helens evokes memories for me because it happened on my watch while I was heading the U.S. Geological Surveys (USGS) Volcano Hazards Program and was thus responsible for directing the surveys scientific response to the eruption.
The 1980 and subsequent eruptions of Mount St. Helens furnish many lessons, not only in terms of scientific findings germane to reducing volcano risk, but also in showing the critical need for effective communications among scientists, emergency-management officials, the media and the populations affected during a volcanic crisis. These lessons have been discussed and analyzed in many hundreds of articles in the scientific literature and in unpublished dissertations. In 1985, Don Peterson, now scientist emeritus at the USGS, observed that the 1980 eruption seems destined to have a disproportionately large influence on scientific concepts of volcanoes and perceptions of volcanic hazards; it very quickly increased worldwide public awareness of problems posed by volcanoes.
Analysis of a precisely timed series of photographs, coupled with eyewitness
accounts, indicated that the north flank of Mount St. Helens began to collapse
within about 15 seconds after a 5.1-magnitude earthquake shook the volcano
at 08:32:11.4 Pacific Daylight Time on May 18, 1980. Only a few seconds
later, the downward movements of blocks collapsing from the volcanos north
flank uncorked the pressurized magmatic system of a cryptodome that had
intruded the north flank, unleashing a powerful, laterally directed blast.
At about the same time, upward-directed explosions began. The collapse
of the north flank produced a rockslide-debris avalanche of 2.3 cubic kilometers,
the worlds largest in historical time.
| Although it lasted less than five minutes, the lateral blast radiated
from the vent on the north flank at speeds of up to 1,000 kilometers per
hour, extending out to distances as great as 28 kilometers and devastating
600 square kilometers of land north of the volcano.
This blast, much more powerful than any other recognized (in hindsight) in the volcanos eruptive history, had a high velocity and temperature, abrasive particle impacts, and suffocating entrained volcanic gases. It was the principal cause of fatalities. |
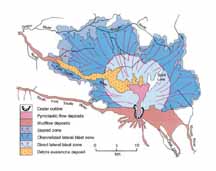
Click here for a larger version. |
Pyroclastic flows probably began shortly after the lateral blast, although they were not directly observed until about noon. A vertical eruption column, which became well developed after the lateral blast was largely spent, was vigorously active for about nine hours and didnt begin to wane until late afternoon. It ceased early on May 19.
Measurable ash fallout from the May 18 eruption affected an area of more than 57,000 square kilometers in eastern Washington and neighboring states. The ash cloud drifted across the country in three days and ultimately circled the globe in about two weeks.
Within ten minutes of the eruptions onset, the interaction of hot volcanic ejecta with snow and ice triggered lahars (volcanic mudflows). The largest and most destructive lahar, however, was generated hours later in the North Fork of the Toutle River by water draining from the huge debris-avalanche deposit and mixing with volcanic debris. The largest lahars, which bulked up on eroded material en route, traveled more than 120 kilometers down the valley of the North Fork Toutle River to the Cowlitz River and Columbia River, causing flooding and widespread changes in channel configuration and sedimentation and also damaging roads, bridges and other structures.
Several compelling lessons from the May 18, 1980, eruption must not
be forgotten:
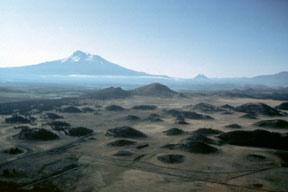
A south-looking aerial view of the hummocky terrain produced by the deposit of a huge debris avalanche that occurred about 300,000 years ago from Mount Shasta (left center at skyline, about 20 kilometers distant). C. Dan Miller, USGS Cascades Volcano Observatory. |
Arguably the most far-reaching scientific findings from the Mount St.
Helens eruption, however, were the direct observations of the flank collapse
and of the hummocky terrain formed by the debris-avalanche deposit. The
origins of similar landscapes in other volcanic regions had long defied
plausible geologic explanation, and the observations at Mount St. Helens
revealed a clear linkage between a volcano sector collapse and a debris
avalanche.
Since the studies of the 1980 Mount St. Helens eruption, debris avalanches have been recognized worldwide at more than 200 stratovolcanoes that have, sometimes repeatedly, undergone collapse events. For example, hummocky terrain adjacent to Californias Mount Shasta, the origin of which long had puzzled geoscientists, is now recognized as the result of a huge sector collapse that occurred about 300,000 years ago. This collapse produced the largest Quaternary subaerial debris-avalanche deposit known in the world. |
Recognizing past debris-avalanche deposits provides unequivocal evidence
that a volcano has undergone sector
collapse in its history, even though subsequent eruptive activity can
reconstruct the volcano edifice and heal the tell-tale collapse scar, a
distinctive U-shaped crater.
Anticipating the eruption
When precursory seismicity and initial phreatic activity started at Mount St. Helens in late March 1980, the USGS began intensive volcano monitoring using seismic, geodetic, gravity, gas-emission and thermal infrared techniques. Seismic monitoring was conducted in cooperation with the Geophysics Program of the University of Washington. Seismic and electronic distance measurement (EDM) data clearly indicated magmatic intrusion high into the volcanic edifice and the growing instability of a bulge on the north flank, but it proved impossible to predict the onset of the paroxysmal events of May 18. Even though scientists failed to provide a specific near-term forecast of flank failure, the monitoring data alerted them that a flank failure might trigger a large magmatic eruption. Indeed, the on-site scientific team discussed this scenario and explained it to emergency-management officials before May 1.
Volcanologists now regard any significant rapid deformation of a volcanic edifice, as was well-documented at Mount St. Helens, as a warning of a potential sector collapse and lateral blast.
A successful but
imperfect response
Besides monitoring the volcano around the clock, USGS scientists also worked daily with the U.S. Forest Service, the principal land manager for Mount St. Helens, as well as two counties and other government agencies, to provide updates of potential hazards and advice on mitigation measures. By April 1, the USGS had prepared a large-scale hazards zonation map. This map and related hazards assessment information were essential for preparing the Forest Services Mount St. Helens Contingency Plan, completed April 9, and for locating roadblocks and where to restrict public access. Had these measures not been taken, the eruption would have caused a considerably more casualties.
However, while the USGS response to Mount St. Helens was successful overall, it was hardly perfect. The lack of equipment along with logistical difficulties meant geodetic measurements of the north flank (bulging at an average rate of about 1.5 meters per day) did not begin until mid-April, several weeks after the bulge wasfirst recognized. As a result, the rate of deformation could not be determined between late March and late April, even though the amount of bulging was estimated with photogrammetry. We will never know how much difference, if any, earlier geodetic measurements might have made in our interpretation of the monitoring data.
Why didnt the USGS and Washington state take more action before 1980?
By repeating the baseline monitoring
measurements that had been initiated in the early 1970s and by developing
protocols for working with other agencies, private organizations and the
public, they could have prepared for a possible reactivation of Mount St.
Helens. After all, the USGS was aware of the potential hazards of Mount
St. Helens as early as the late 1960s. Moreover, in 1975 three USGS geologists
(Dwight Crandell, Donald Mullineaux and Meyer Rubin) published in Science
a long-term forecast that Mount St. Helens would be the most likely volcano
in the Cascade Range to reawaken, possibly even before the end of the
20th century.
In 1978, Crandell and Mullineaux published a detailed volcano-hazards assessment, which was little noticed when first released but in 1980 was the report most widely read by scientists and emergency-management officials between the onset of activity (March 27) and the climactic eruption. However, neither Washington state nor the USGS responded to these pre-1980 findings, apparently not convinced of any urgency to undertake more hazards-related studies or to prepare long-range contingency plans.
The USGS reluctance to take action stemmed from a perception that funds were insufficient for additional work in the Cascades, because repeated efforts over the years to obtain increased appropriations for volcano-hazards studies had all failed. At the time, the agency chose to focus its limited resources for volcano studies in Hawaii.
After the 1980 eruption, however, funding for the USGS Volcano Hazards Program increased significantly and was more than sufficient to establish the Cascades Volcano Observatory in Vancouver, Wash., to monitor Mount St. Helens as well as other Cascades volcanoes. The funding also expanded or started studies at other volcanoes in the United States. The lesson here is obvious and disturbing: Justification for increased funding of volcano-hazards studies is greatly strengthened and perhaps only receives serious attention following a noteworthy volcanic crisis or disaster.
Ruiz and Pinatubo
Since 1980, scientists have made numerous advances in acquiring and
interpreting volcano monitoring and other data for understanding eruptive
processes and products. Several volcanic crises and disasters worldwide
have provided additional lessons and insights for the effective reduction
of volcano risk. The scientific and public responses to, and the resulting
outcomes of, two volcano crises Nevado del Ruiz (Colombia) in 1985 and
Mount Pinatubo (Philippines) in 1991 provide telling lessons regarding
the critical importance of effective communications among scientists, emergency
managers and residents during volcanic crises.
On Nov. 13, 1985, a very small amount of magma (only 0.02 cubic kilometers) erupted from Colombias Nevado del Ruiz volcano, triggering destructive lahars that increased in volume as they flowed down the steep valleys and collected eroded material en route. These lahars killed more than 23,000 people, resulting in the second worst volcanic disaster in the world after the deadly 1902 Mont Pelée catastrophe.
However, the Ruiz tragedy could and should have been averted, because a hazards-zonation map had been prepared a month earlier and scientists had provided adequate warning. In an authoritative post-mortem, Barry Voight of Pennsylvania State University concluded: The [Ruiz] catastrophe was not caused by technological ineffectiveness or defectiveness, nor by an overwhelming eruption or an improbable run of bad luck, but rather by cumulative human error.
The Ruiz disaster was the impetus for the International Association of Volcanology and Chemistry of the Earth to produce Understanding Volcanic Hazards, a video that graphically shows the deadly outcomes of volcano disasters, and Reducing Volcanic Risk, a video that emphasizes what communities can do to reduce volcano risk.
The Ruiz experience also launched the Volcanic Disaster Assistance Program (VDAP) in 1986, which is jointly funded by the USGS and the Office of Foreign Disaster Assistance of the U.S. Agency for International Development. Once officially invited, the USGS-VDAP team can quickly deploy (generally within a few days) a mobile volcano observatory to help host-country scientists respond to volcanic crises. To date, the USGS-VDAP program is the only rapid-response team of its kind in the world. It represents a significant, new approach to reducing volcano risk in developing regions. The USGS-VDAP team has worked in Ecuador, Guatemala, Indonesia, Mexico, Montserrat, Nicaragua, Papua New Guinea and the Philippines not only to respond to volcanic crises but also to help build local monitoring capabilities and to train scientists.
In contrast to the 1985 Ruiz catastrophe, the response of scientists and emergency-management officials to the 1991 eruption of Mount Pinatubo (Luzon, Philippines) was highly successful, saving thousands of lives and reducing economic loss by hundreds of millions of dollars. The climactic eruption of Pinatubo on June 15, 1991, was huge (about five cubic kilometers) the largest in the world since the 1912 eruption of Novarupta, part of Alaskas Mount Katmai. But fatalities directly attributed to Pinatubo numbered fewer than 300. The key to the Pinatubo success was the timely evacuation of approximately 250,000 people. Scientists from the Philippine Institute of Volcanology and Seismology and the USGS-VDAP team educated the local authorities and populations about the eruption and its potential hazards. They used a draft version of Understanding Volcanic Hazards to convince the local officials to order evacuations and the people at risk to comply.
Averting Volcanic Disasters
Some trends of the past two decades continue into this century. Most important will be to continue developing and improving real-time volcano monitoring methods and networks, especially for geodetic and geochemical parameters. As satellite-based geodetic technology (space geodesy) becomes more sensitive, precise, cost-effective and real-time, it should supplement, and gradually supplant, ground-based monitoring.
A network of Global Positioning System receivers, for example, can provide real-time, continuous volcano monitoring. Such networks are being tested at the Long Valley caldera in California and other volcanoes.
Satellite-based synthetic aperture radar (SAR) is capable of seeing through clouds and darkness to provide useful images of restless volcanoes, and interferometric analysis of repeated SAR images (InSAR) can, in some cases, provide maps of surface deformation. InSAR analyses have already shown great promise in detecting and characterizing far-field deformation at Etna Volcano in Italy, at the Yellowstone caldera in Wyoming, and at the Long Valley caldera in California, along with several volcanoes in the Aleutian volcanic arc. Similar improvements in technology and data processing can be expected for satellite-based measurements of emissions of sulfur dioxide and perhaps of other diagnostic volcanic gases.
Optimum volcano monitoring requires a combination of approaches rather than reliance on any single technique, ground- or space-based. Moreover, during a rapidly developing volcanic crisis, monitoring techniques need to be reliable and robust, simple and fast (real-time to the extent possible) and safe for an onsite scientific team. With satellite-based volcano monitoring networks, scientists can acquire data remotely without exposing field crews to hazardous working conditions at restless or erupting volcanoes.
Worldwide eruption frequency (on average, about 60 volcanoes are active each year) is not likely to decrease in the foreseeable future. Thus, with continued growth in world population, economic development and urbanization, the global problem of volcano hazards will inexorably become more acute. Even as we look forward to continuing advances in volcanology and volcano hazards studies, the 1985 Ruiz disaster provides a tragic reminder that good science alone is insufficient to mitigate volcano risk. The greatest payoff in volcano-risk reduction in the immediate future will most likely come from increased focus on the societal and human issues that emerge during volcanic crises and from developing or improving communications among scientists, emergency managers, news media, educators and the general public. A major challenge indeed, a goal for volcanologists and other scientists is to prevent volcanic crises from turning into volcanic disasters.
 |
Geotimes Home | AGI Home | Information Services | Geoscience Education | Public Policy | Programs | Publications | Careers |