Geotimes
Feature
SAR: A Versatile
New Tool for Earth Science
Rosalind T. Helz, John LaBrecque and William G. Pichel
Sidebar: SAR
survival
Invented in the 1950s to permit radar to achieve fine spatial resolution in the
cross-track direction, synthetic aperture radar (SAR) played a key role in NASA’s
Shuttle Imagery Radar experiments flown in the 1980s. Since then, widespread availability
of data from SAR has permitted the technology’s application to a broad range
of geoscience problems. The field has blossomed in the last decade, benefiting
from the wealth of SAR data collected from a series of satellites launched in
the early- to mid-1990s: the European Remote Sensing (ERS) satellites launched
by the European Space Agency, the Japanese Earth Resources Satellite (JERS), and
the Canadian RadarSat (see story, this issue). The most dramatic
results include detailed imagery of Antarctica’s ice sheets and images of
the strain associated with earthquakes, such as the Hector Mine quake of Oct.
16, 1999, in California.
Like all other kinds of radar, SAR sensors send out a radio wave and collect the
reflected signals for interpretation. SAR data can provide accurate digital topography.
Scientists depend on SAR’s all-weather, day and night capability to detect
and monitor floods, oil spills or storm damage as quickly as possible, without
having to wait for a clear day. Perhaps the most exciting applications of SAR
data involve using pairs of images to detect and measure changes in the shape
or position of the Earth’s surface. This application, called interferometric
SAR, or InSAR, has the potential to let us anticipate volcanic eruptions and earthquakes,
and allows us to monitor the movement of ice sheets and the effects of movement
or withdrawal of fluids (water, oil or gas) in shallow reservoirs. The future
holds still other applications, especially as scientists begin to explore the
capabilities of new SAR sensors that operate at different wavelengths. Further
progress in these areas will depend on a (yet-to-launch) second generation of
radar satellites (see sidebar).
Mapping Earth
Earth scientists need good topographic data as a base on which to plot all
other geologic information, whether bedrock or surficial geology, fault locations
or other structural information. The advent of GIS (geographic information systems)
and digital mapping requires that the topographic information also be digital.
Modeling of mass flow (whether water, landslides and debris flows, or volcanic
materials) also requires digital topography as a key input for calculations.
In spite of the acute need, good digital topography is not widely or easily
available for most of the Earth’s surface. SAR can help.
 By measuring
the time between transmitting a signal and receiving its return, SAR sensors
can measure the distance between the source/receiver and the reflecting surface,
and so can be used to generate topography. Recently, NASA and the National Imagery
and Mapping Agency used a SAR sensor carried aboard the space shuttle to image
more precisely the Earth’s land surface topography between 60 degrees north
and 56 degrees south. When fully processed, these data will provide greatly
improved digital topography for most of the Earth’s land cover.
By measuring
the time between transmitting a signal and receiving its return, SAR sensors
can measure the distance between the source/receiver and the reflecting surface,
and so can be used to generate topography. Recently, NASA and the National Imagery
and Mapping Agency used a SAR sensor carried aboard the space shuttle to image
more precisely the Earth’s land surface topography between 60 degrees north
and 56 degrees south. When fully processed, these data will provide greatly
improved digital topography for most of the Earth’s land cover.
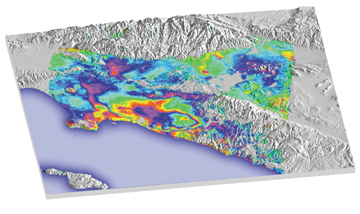
Satellite radar interferogram draped over the topography of Los Angeles, Calif.
The repeating color bands of the large oval show about two inches of subsidence
throughout the basin between May and September 1999. The Newport-Inglewood fault
is the straight line located just inside the coast line. The small isolated
‘bull’s eye’ feature (left center) is from pumping activity in
the Inglewood oilfield. Image courtesy of G.W. Bawden (Bawden et al., Nature,
412, 812-815, 2001).
Monitoring hazards
The largest class of applications of SAR involve simply looking at a single
image (or scene) or a mosaic of scenes. Because it uses radio waves, the SAR
signal penetrates clouds, whether the result of weather, dust storms or volcanic
ash. SAR does not depend on sunlight because the sensor sends out its own beam
of energy, so SAR imagery can be obtained at any time of day or night.
SAR imagery applications are becoming routine, limited only by availability
of data (see sidebar). The International Charter for
Space and Major Disasters, recently organized by a consortium of space agencies
to provide free satellite imagery in response to a disaster, has been activated
16 times since it began in November 2000. In 42 percent of the cases, the request
was triggered by a flood or an oil spill, and in each of these events, SAR imagery
was specifically requested.
Sea Ice Hazards. All-weather SAR imaging of the high-latitude seas provides
information that is vital to minimizing the danger of sea ice to shipping and
other maritime activities. Observing the edge of the ice pack as well as the
position of icebergs with SAR imagery is becoming the accepted technique for
monitoring this hazard. SAR is also a useful tool for tracking spring breakup
of major rivers in northern regions (for example in the Yukon in Alaska and
the Yellowstone in Montana). European and Canadian SAR imagery has been used
to monitor the onset of breakup, ice runs, ice jams and flooding due to ice
jams.
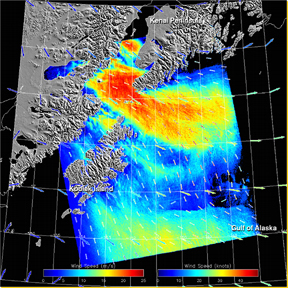
SAR-derived surface wind-speed image
at 1-kilometer resolution from a RADARSAT-1 image taken Dec. 13, 2001, of
the Gulf of Alaska near Kodiak Island. Color represents wind speed. Image
courtesy of Frank Monaldo, the Johns Hopkins University Applied Physics
Laboratory, and Christopher Wackerman, General Dynamics Advanced Information
Systems. Click
here to get more details and see a larger image. |
Wind Tracking. The National Oceanic and Atmospheric Administration (NOAA)
uses SAR in coastal regions to monitor strong wind events such as gap winds,
downslope winds and barrier jets. SAR imaging is uniquely capable of measuring
winds close to the coast and even in bays, rivers and lakes. The resulting data
can be used to issue alerts for maritime traffic and low-flying aircraft.
Oil Slicks. Because oil slicks affect the roughness of the ocean’s
surface, researchers can use SAR imagery to detect and track anthropogenic and
natural oil slicks. This ability is especially useful in the enforcement of
pollution laws because SAR can constantly monitor potential violations —
a critical capability, as most large oil spills at sea occur as a result of
severe weather. Oil slick tracking is also of great importance in the containment
of oil spills. Winds derived from SAR can provide local wind conditions for
use in oil spill trajectory models.
Floods and Hurricanes. SAR images show areas inundated by rising flood
waters in support of disaster response efforts. Such images can be used for
rapid damage assessment during and immediately after a flood, when the area
may still be obscured by clouds. The inundation patterns recorded by SAR can
assist in quantitative damage assessment and mitigation planning. SAR images
can also provide rapid damage assessment after major hurricanes, when cloud
cover and damaged infrastructure (telephones, roads, bridges) make conventional
surveys difficult.
Seeing Earth move
The SAR application of most importance to the geosciences is the use of SAR
interferometry to detect deformation of Earth’s surface. This new technique
requires two radar images of the same area of Earth’s surface, taken from
the same point in space at different times. When scientists process the reflected
signals and compare the phase history of the reflected waves for the two images,
they can obtain a very detailed look at any changes in the shape or position
of the reflecting surface that occurred in the time elapsed between taking the
two scenes. The image of the phase differences is called an interferogram. The
pattern and amount of deformation is customarily shown by using color fringes
from the visible spectrum. If too much change has occurred before the second
image is taken, we get “decorrelation” of the surface. What we see
in the image is areas with random speckles, instead of an interpretable pattern
of deformation.
The resolution of SAR and InSAR is a function of the wavelength and bandwidth
of the signal and the sensitivity and power of the satellite system. Shorter
wavelength SAR imagery (for example, C-band SAR, with a wavelength of 5.66 centimeters)
generally produces higher-resolution images. However, decorrelation is more
of a problem because the shorter wavelengths are more sensitive to small changes
at Earth’s surface, including changes in vegetation. Longer wavelength
SAR imagery (L-band SAR, with a wavelength of 23.53 centimeters) usually produces
lower-resolution images, but it is more forgiving of the small-scale instability
of many natural surfaces. It also penetrates vegetation more effectively than
the shorter SAR signals.
Modern SAR satellites can image thousands of square miles in a few minutes,
so it is possible, in principle, to use InSAR to monitor surface changes with
great precision over large areas. InSAR detection of surface deformation complements
the results obtained from ground-based GPS networks, which allow monitoring
of deformation continuously in time, but only at preselected points. InSAR is
not continuous in time, as repeat views are typically obtained only every 35
to 45 days. However, it does document areal patterns of deformation. Such imaging
offers new promise in the forecasting of volcanic eruptions, earthquakes, landslides,
the direct measurement of erosion, the motion of ice streams and glacial retreat,
and other forces that sculpt Earth’s surface.
Earthquakes and Regional Deformation. The most challenging goal for InSAR
is mapping slow surface deformation. This includes the accumulation of strain
leading up to earthquakes, as well as transient strain relaxation following
earthquakes. Scientists supported by NASA, the U.S. Geological Survey and the
National Science Foundation, under EarthScope and other initiatives, are seeking
repeated measurement of surface change in seismically active areas along the
Earth’s plate boundaries, where the highest probability of earthquakes
exists. This new knowledge will refine our understanding of earthquake hazards
along major seismic zones. Repeated InSAR imaging of active fault zones will
help illuminate the strain patterns associated with these fault zones, before
and after earthquakes. We do not expect to actually “catch” the moment
of the quake itself. If InSAR ever did take an image exactly at the time of
surface shaking, scientists would only see a decorrelation pattern.
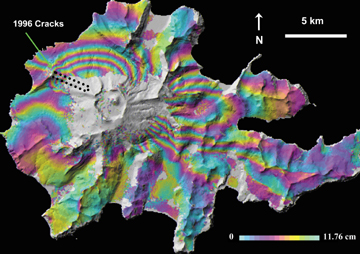 |
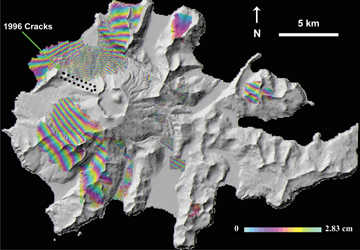
A strong earthquake swarm on Akutan
Island that occurred in March 1996 produced extensive ground deformation,
including an area of visible ground cracking (dotted lines). The two interferograms
show how the deformation field looks in C-band imagery (below, over a
rainbow scale of 2.83 centimeters) and in L-band imagery (above, over
a rainbow scale of 11.76 centimeters). The longer L-band wavelength provides
a much more complete look at the complex deformation field. Images by
Zhong Lu, EROS Data Center, US Geological Survey.
|
 |
Volcanic Activity. Sequences of InSAR images for Etna in Italy and for
Okmok and Westdahl volcanoes in Alaska dramatically show both the inflation
of their surfaces before the eruptions and the subsidence that followed. These
images hold great potential for predicting an impending eruption and analyzing
the volume of erupted magma afterward. Applying the same technique to volcanoes
thought to be dormant has allowed us to see that some of them — including
Three Sisters in the Cascades and Peulik in Alaska — are actively changing
shape in response to the movement of magma and gases beneath the volcano. Thus
InSAR data can help us define both the long-term and near-term risk to citizens
and infrastructure from volcanic hazards.
The all-weather capability of InSAR makes it an important addition to the existing
monitoring systems (weather satellites and seismic and GPS networks) used to
watch the more than 100 volcanoes of the Aleutian, Kamchatkan and Kurile volcanic
arcs. This new technique should further mitigate the potential damage from eruptions
and volcanic ash clouds to all aircraft that fly these busy North Pacific jet
routes. Because SAR satellites can image all parts of the Earth, InSAR data
also can provide important new warning capabilities to help mitigate the effects
of eruptions at volcanoes in areas where ground-based monitoring systems are
sparse or lacking.
Ground Subsidence. InSAR has demonstrated its ability to measure surface
subsidence and rebound in response to aquifer discharge and recharge in regions,
such as Los Angeles, Las Vegas, Houston and other cities, dependent on subsurface
water. It can also be used to monitor withdrawal of gas and petroleum and has
the potential to monitor subsidence associated with karst or collapse of abandoned
mines. Some of these applications, especially monitoring oil and gas withdrawal,
are already commercially significant.
Ice Sheets and Glaciers. Ice sheets and mountain glaciers contain 80
percent of the world’s fresh water. As their volume decreases, they contribute
to rising sea level, which endangers heavily populated low-lying areas around
the world. SAR, and especially InSAR, can help monitor the volume and dynamics
of the Earth’s glaciers and ice caps because the technology can see through
the clouds that might shroud them. SAR imagery provides an unprecedented series
of snapshots of the ice sheets, and InSAR documents short-term changes in them.
The recent (and unexpected) disintegration of large portions of the ice shelves
of the Antarctic Peninsula emphasizes the importance of ice-sheet monitoring,
whether for safety of human activities in adjacent areas or for understanding
the effects of longer-term changes in sea level and climate.
|
SAR
survival
Many civilian scientists who rely on SAR or InSAR data for their research
might dream of complete satellite coverage of Earth’s surface, but
the reality is that the data available are spotty — and are potentially
about to get spottier.
A total of three working SAR satellites orbit the Earth at the moment,
one from Canada (RADARSAT-1) and two from the European Space Agency (ERS-2,
ENVISAT). But the ERS-2 is on its last legs, and RADARSAT-1 is well into
its operational lifetime. Canada and Japan have plans for two new satellites
in the next few years. Purchasing images from the other satellite-managing
countries, however, can be expensive, ranging from several hundred to
thousands of dollars for one image.
In the 1990s, U.S. SAR-based researchers formed WInSAR, a consortium of
25 institutions — including NASA, the U.S. Geological Survey and
the National Science Foundation — to obtain data from European SAR
satellites. “Going to foreign suppliers, which is what we’ve
been doing the last 10 years, has worked reasonably well,” says Howard
Zebker, a geophysicist at Stanford University in California, and good
research has come entirely from those data. However, having a U.S.-run
satellite would make things better, Zebker says.
But development of a U.S. SAR satellite cannot happen overnight. Even
if the decision were made today to develop such a satellite, the earliest
that it could be launched would be 2008 or 2009. “It is a problem,”
says John Pallister, a research geologist at Cascades Volcano Observatory
and former USGS Volcano Hazards Program coordinator, “in the sense
that the uses of SAR data are increasing dramatically, in part because
we’ve discovered what a good tool it is for monitoring ground deformation
from space, whether it’s groundwater or volcanoes.”
But time, power and downloading capabilities are limited for active satellites,
and target selection requires careful planning. Countries with satellites,
Pallister says, give priority to their own researchers. “The ideal,
looking toward the future, would be a constellation of SAR satellites.”
However, getting even one U.S. satellite launched has proven difficult,
says Jean-Bernard Minster, a geophysicist at the University of California,
San Diego. Over the past few years, NASA has judged several proposals
for satellite missions (co-authored by Minster and others) to be budgeted
unrealistically, Minster says; such missions can cost several hundred
million dollars or more and take years to plan. However, Minster says
another opportunity to propose an earth-observing satellite with SAR equipment
will come this February, with another round of NASA applications.
Says Zebker: “Sometime soon, researchers are going to get to large
problems that will require more data than can be begged, bought or borrowed
from foreign satellite owners.”
Naomi Lubick
Back to top
|
Helz is associate coordinator
of the USGS Volcano Hazards Program. LaBrecque manages NASA’s Solid Earth
and Natural Hazards Program. Pichel is with NOAA’s Office of Research and
Applications. We appreciate review comments from John Pallister and R.J. Thompson
(USGS) and from Craig Dobson (NASA).
Links:
"Snapshots from Space of the World's
Continents," Ahmed Mahmood et al., Geotimes, November 2003
Back to top
