Geotimes
Feature
Snapshots from Space
of the World’s Continents
Ahmed Mahmood, Kenneth C. Jezek, Surendra Parashar and Laurent-Philippe
Giugni
Studying Earth as a system — including the hydrological, biological, geochemical,
cryospheric and solid earth components — requires routine acquisition of
high-resolution, synoptic-scale observations that can be composited into snapshots
of Earth in a sequence of moments. Only space-borne imaging instruments can
provide this sort of data, and synthetic aperture radar (SAR) data are particularly
well-suited for this task (see story, this issue).
As an active microwave sensor, SAR in general can image in day or night and
through most weather conditions. The SAR onboard Canada’s RADARSAT-1 satellite
has additional important attributes, including selectable resolutions from 10
to 100 meters and swath widths from 50 to 500 kilometers. The resulting images
can be mosaicked together to generate near-instantaneous views of continental
proportions.
In 1998, we reported in Eos on global remote sensing data campaigns using
RADARSAT-1 and including the Canadian Space Agency’s Background Mission.
The following are some of the products from those campaigns in the form of image
mosaics. We created these mosaics from RADARSAT-1’s ensemble of beams.
They render single-season views of entire continents and could serve as benchmarks
for monitoring global change.
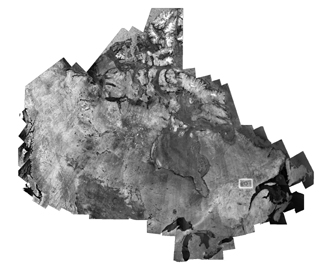 Canada:
A Winter View This winter view of the entire Canadian
landmass and its coastal zones was compiled with images acquired mainly during
the week of Jan. 25, 1999. The 276 images mosaicked together were acquired in
roughly 80 ScanSAR Narrow beam swaths, the first received on January 25 and
the last on February 2. Each of the images in the mosaic has a pixel spacing
of 50 meters. The full-resolution mosaic is provided at 150-meter pixel spacing.
This unique image product is a true picture of Canada at a given point in time.
It shows the Hudson Bay sea ice and its coastal contact, the shape of land features
in the winter of 1999, and, presumably, even a transient weather-related element
in the form of a white band in the lower right corner of the mosaic, which runs
across southern Ontario and west-central Quebec. Such temporal views created
on a seasonal and multi-annual basis can help us understand the impact of environmental
changes and human actions on a region’s ecosystems and natural resources.
Canada:
A Winter View This winter view of the entire Canadian
landmass and its coastal zones was compiled with images acquired mainly during
the week of Jan. 25, 1999. The 276 images mosaicked together were acquired in
roughly 80 ScanSAR Narrow beam swaths, the first received on January 25 and
the last on February 2. Each of the images in the mosaic has a pixel spacing
of 50 meters. The full-resolution mosaic is provided at 150-meter pixel spacing.
This unique image product is a true picture of Canada at a given point in time.
It shows the Hudson Bay sea ice and its coastal contact, the shape of land features
in the winter of 1999, and, presumably, even a transient weather-related element
in the form of a white band in the lower right corner of the mosaic, which runs
across southern Ontario and west-central Quebec. Such temporal views created
on a seasonal and multi-annual basis can help us understand the impact of environmental
changes and human actions on a region’s ecosystems and natural resources.
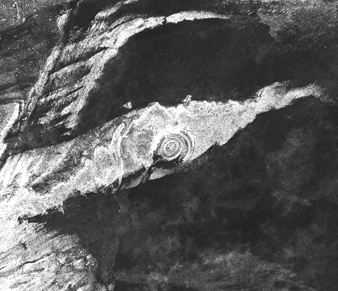
 A
Closer Look At Craters These wide-area
digital radar image mosaics can be used for a variety of applications. For example,
the preserved record of terrestrial impact craters is several factors smaller
than the integrated impact flux estimates and erosional rates for such landforms
would suggest. This means that there is a vast “missing record” lurking
in those parts of Earth’s continental geologic record for which the wide-area
surveys are either nonexistent or hampered by difficulties associated with access,
weather and land cover. A clear advantage with radar images in comparison with
the optical images is the tonal and textural properties of the radar images
that suppress superficial effects and enhance the structural and morphological
contrasts, as seen here on the crater site from Canada (see white box, above;
for a close-up view of a crater in Africa, see below).
As one of the many applications of SAR data, these mosaics therefore have good
potential use in inventorying Earth’s impact craters.
A
Closer Look At Craters These wide-area
digital radar image mosaics can be used for a variety of applications. For example,
the preserved record of terrestrial impact craters is several factors smaller
than the integrated impact flux estimates and erosional rates for such landforms
would suggest. This means that there is a vast “missing record” lurking
in those parts of Earth’s continental geologic record for which the wide-area
surveys are either nonexistent or hampered by difficulties associated with access,
weather and land cover. A clear advantage with radar images in comparison with
the optical images is the tonal and textural properties of the radar images
that suppress superficial effects and enhance the structural and morphological
contrasts, as seen here on the crater site from Canada (see white box, above;
for a close-up view of a crater in Africa, see below).
As one of the many applications of SAR data, these mosaics therefore have good
potential use in inventorying Earth’s impact craters.
|
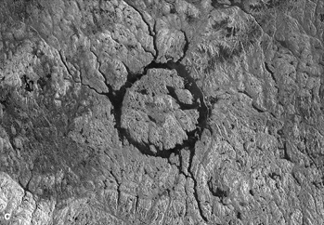
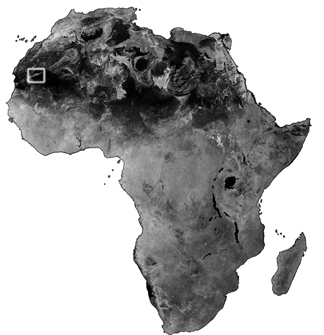 Mapping
Africa This RADARSAT-1 image mosaic (left) of Africa is split along
the vegetation line that coincides roughly with 10 degrees north, separating
the African sub-Sahara from the Sahara. The northern and the Saharan parts
of Africa were imaged at a coarser resolution of 50 meters with the satellite’s
ScanSAR Narrow beam and the remainder of the continent with the 25-meter-resolution
ScanSAR Wide beam. The structural and vegetation contrast of the SAR images
manifests itself in several regions, including the rainforest of the Congo
basin, the east-African rift structures and the west-African dykes that
extend offshore, along which a number of volcanic peaks are aligned. The
full-resolution digital mosaic should aid African ecological studies and
resource management.The
crater shown here (below) is at the center of the white box on the African
continent (to the left). Mapping
Africa This RADARSAT-1 image mosaic (left) of Africa is split along
the vegetation line that coincides roughly with 10 degrees north, separating
the African sub-Sahara from the Sahara. The northern and the Saharan parts
of Africa were imaged at a coarser resolution of 50 meters with the satellite’s
ScanSAR Narrow beam and the remainder of the continent with the 25-meter-resolution
ScanSAR Wide beam. The structural and vegetation contrast of the SAR images
manifests itself in several regions, including the rainforest of the Congo
basin, the east-African rift structures and the west-African dykes that
extend offshore, along which a number of volcanic peaks are aligned. The
full-resolution digital mosaic should aid African ecological studies and
resource management.The
crater shown here (below) is at the center of the white box on the African
continent (to the left).
|
Antarctica Revealed [see
print issue for image] This
first high-resolution (25-meter pixel spacing) radar mosaic of Antarctica was
compiled from RADARSAT-1 Standard and Extended Low beam data acquired during
an 18-day period in September and October of 1997. The image is a remarkable
depiction of the southern continent. The boundary separating seasonal sea ice
from the ice sheet and the few rocky areas of the coastline is clearly evident.
Short-term summer melting results in morphologic changes to the near-surface
snow, which then appears in the mosaic as bright regions around the perimeter
of the continent. The large-scale bright and dark patterns across the continental
interior are mainly caused by spatial changes in surface accumulation rate.
The thousands of kilometers of sinuous bands that wind across east Antarctica
are associated with ice flow divides. Preliminary comparisons between the 1997
and 2000 data sets reveal complex changes in the ice sheet margin and document
the continued retreat of Antarctic Peninsula ice shelves.
Mahmood, Parashar and Giugni
are all with Space Operations at the Canadian Space Agency in Saint-Hubert, Quebec,
Canada. Jezek is at the Byrd Polar Research Center at the Ohio State University
in Columbus, Ohio. The authors thank James B. Garvin of the Goddard Space Flight
Center in Maryland for his continuous advice in the course of RADARSAT-1 Background
Mission planning and data use. For more information, email Mahmood: Ahmed.Mahmood@space.gc.ca.
The Canada and Africa mosaics were prepared by Radarsat International of Richmond,
British Columbia, under a project implemented jointly with the Canadian Space
Agency. The Antarctic data acquisition and mosaic preparation was the result of
the Canadian Space Agency and NASA RADARSAT-1 partnership program, and a contract
to Byrd Polar Research Center of the Ohio State University, as well as a grant
from NASA’s Pathfinder and Polar Ocean and Ice Sheets Programs.
Links:
"SAR: A Versatile New Tool for Earth Science,"
Rosalind T. Helz et al., Geotimes, November 2003
Back to top