Geotimes

Untitled Document

Geomedia
Geotimes.org offers
each month's book reviews, list of new books, book ordering information and new
maps.
Check out this month's On
the Web links, your connection to earth science friendly Web sites. The popular
Geomedia feature now available by topic.
Book Reviews:
The End of Oil?
Uncertain weather
Maps:
Digital mapping in Kentucky
Book review
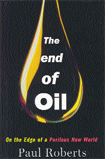
 The
End of Oil: On the Edge of a Perilous New World The
End of Oil: On the Edge of a Perilous New World
by Paul Roberts. Houghton Mifflin Company,
2004. ISBN 0 6182 3977 4. Hardback, $26.
|
 The
Oil Factor: Protect Yourself — and Profit — from the Coming Energy
Crisis The
Oil Factor: Protect Yourself — and Profit — from the Coming Energy
Crisis
by Stephen Leeb and Donna Leeb. Warner Business
Books, 2004. ISBN 0 4465 3317 3. Hardback, $24.95.
|
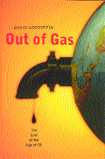
 Out
of Gas: The End of the Age of Oil Out
of Gas: The End of the Age of Oil
by David Goodstein. W.W. Norton and Company,
2004. ISBN 0 3930 5857 3. Hardback, $21.95.
|
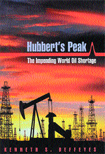
 Hubbert’s
Peak: The Impending World Oil Shortage Hubbert’s
Peak: The Impending World Oil Shortage
by Kenneth S. Deffeyes. Princeton University
Press, 2003 (revised edition). ISBN 0 6911 1625 3. Paperback, $16.95.
|
 The
Party’s Over: Oil, War and the Fate of Industrial Societies The
Party’s Over: Oil, War and the Fate of Industrial Societies
by Richard Heinberg. New Society Publishers,
2003. ISBN 0 8657 1482 7. Paperback, $17.95.
|
The End of Oil?
Rasoul Sorkhabi
Several books addressing “the end of oil” over the past two years
should draw wide public attention because they are published in a time of high
oil and gasoline prices. This year, the price of U.S. crude oil has exceeded
$50 a barrel, with gasoline prices in many states reaching more than $2 a gallon.
To talk about the “end of” things often implies doomsday sentiments.
It is unfortunate that books about such fundamental things as nature, science
and oil should draw our attention only if they are entitled The End of Nature
(Bill McKibben), The End of Science (John Horgan) and now The End
of Oil (Paul Roberts). Oil and natural gas account for more than 60 percent
of energy consumption in the world, and Americans use one-quarter of world energy.
These facts alone justify energy literacy, policy debates, news coverage and
the popularization of petroleum geoscience and economy.
Just as predictions of our oil future are difficult and uncertain, so are evaluations
of these predictions. Only time can tell how successful or invalid a prediction
is. Over the past century, there have been predictions of “the world running
out of oil” and counterarguments. The best we can do is to evaluate the
approaches, assumptions, scope, input data, uncertainties and implications of
these predictions. Unfortunately, these methodological aspects are rarely discussed
in popular media, with attention instead focused on speculative conclusions
about the future of oil.
The style and focus of each of five books about “the end” of oil reflect
each author’s profession. Deffeyes (Hubbert’s Peak) is a petroleum
geologist and a professor at Princeton. He has enriched his book with anecdotes
of wit and wisdom. Paul Roberts (The End of Oil) is a regular contributor
to Harper’s magazine. His book is based on many interviews, correspondence
and travels. It is all prose with no diagrams to enhance the text or show trends
in numerical data. Richard Heinberg (The Party’s Over) is an author
concerned about social issues. His book is a distillation of energy facts and
opinions from various publications. David Goodstein (Out of Gas) is a
physics professor at Caltech and the author of popular science books. He explains
the scientific basis of other energy resources assuming that we are at the end
of the oil age. Stephen and Donna Leeb (The Oil Factor) are stock market
experts, and they discuss the economic implications and investment opportunities
of the end-of-oil phenomenon.
The philosophy of these books is rooted in the pioneering work of the late M.
King Hubbert, a famous petroleum geoscientist of the past century. In 1956,
Hubbert predicted that U.S. oil production would peak in 1970. Being an experienced
petroleum geologist, Hubbert knew that the production profile (a graph of oil
production per year) of an oil reservoir has a bell shape, with an initial increase
in production, then a peak and finally a decline with time. Hubbert applied
this approach to oil fields in the lower 48 states, and his prediction remarkably
was shown true: U.S. domestic production of oil has not regained its peak 1970
level.
In recent years, several petroleum geologists have forecasted that world oil
production would peak sometime in the first half of this century. Colin Campbell
is among the prominent revivers of Hubbert’s method, and the end-of-oil
books mostly feed on the ideas developed in his publications, including The
Coming Oil Crisis (1997) and an article in the March 1998 Scientific
American called “The End of Cheap Oil.” The estimates of peak
world oil production (also called Hubbert’s Peak, at which 50 percent of
oil reserves are depleted) range from 2000 to 2010 (by Hubbert, Campbell and
Deffeyes) to 2030 to 2040 (by the U.S. Geological Survey, the Department of
Energy and the International Energy Agency). Roberts categorizes the lower values
as “pessimistic” and the higher values as “optimistic” predictions.
The lower estimates are based on the assumption that the world’s recoverable
oil resources are 1.8 to 2.1 trillion barrels, while the upper estimates place
it at 3.7 to 4.7 trillion barrels.
Given the finite amount of oil resources, Hubbert’s Peak will occur in
the future, but this does not mean that the world will soon run out of oil.
Before we reach the peak oil, production will actually increase. As our access
to oil reserves expands, the timing of Hubbert’s Peak also is pushed further
into the future.
As we apply the production/depletion method from a reservoir scale to the global
scale, the range of our uncertainty also increases because we do not know the
total amount of oil reserves. Moreover, the shapes of oil production profiles
(as we see in real reservoirs) are rarely symmetrical because of several factors,
such as underestimates of oil reserves in a field or the use of secondary-recovery
techniques by production engineers to keep oil flowing. In other words, the
downslope (decline in production) of Hubbert’s Peak will take a longer
time than its upslope (increase in production).
Note that our current technology has a recovery efficiency of 35 to 40 percent.
Thus, about 60 percent of discovered oil remains underground and some of this
can be produced by advanced techniques in the future. If oil prices remain high,
petroleum companies will have economic incentives to invest more in new exploration
and better production. Deepwater reserves, polar region discoveries, liquefied
natural gas, coal gasification, tar sands, oil shale and methane hydrates are
prospects that may gradually be added to current “conventional” hydrocarbon
resources.
Nevertheless, it is useful to analyze the end-of-oil scenarios in the spirit
that “forewarned is forearmed.” Rene Dubos, one of the greatest scientist-environmentalists
of our time, once remarked that “trends are not destiny.” As most
of the authors of these books contend, we need to decrease our dependency on
oil and develop technologies that use other energy resources. Opinions vary,
however, as to what other energy resources we should utilize. Deffeyes and Goodstein
welcome the use of nuclear energy; Roberts highlights the near-future use of
hydrogen fuel; and Heinberg prefers environmentally friendly, renewable energy
sources (such as solar, hydraulic and wind power) and argues against the nuclear
option.
If Hubbert’s Peak occurs in the coming decades (in our own lifetimes),
we can envision an energy-mix scenario for the world in which energy resources
other than oil and gas will be increasingly utilized depending on local conditions.
Our civilization should adopt this approach sooner rather than later not because
oil is fast coming to an end, but for the more important reason that oil is
too precious to be wasted in the ways we are currently using it.
Burned up as a fuel, oil is lost forever, pollutes the air and contributes to
global warming by emitting carbon dioxide. Meanwhile, about 90 percent of the
organic chemicals we use (plastics, agricultural chemicals and pharmaceuticals)
come from petroleum. A barrel of oil burned up is subtracted from the world’s
oil reserves, never to be replaced (at least for millions of years). Therefore,
conserving oil resources, increasing energy efficiency and utilizing other resources
will ensure that future generations will not be deprived of thousands of petrochemical
products we are privileged to use.
Roberts points out that once economic conditions are right, petroleum companies
themselves will build a new energy engine for the world because these companies
are well-financed and experienced. This fact does not preclude companies now
specializing in nonpetroleum resources from tapping the market. There are, however,
indications that some major petroleum companies are positioning themselves to
play a significant role in the “energy mix” market of the future.
The Leebs argue in their book that since the first oil shock in 1973, “the
economy and stock market have danced to oil’s tune.” Sharp rises in
oil prices have led to economic recession or stagnation and stock market crashes,
while “good times” have been during low oil prices. They call this
pattern the “amazing oil indicator.” These authors also foresee that
oil prices are set to soar, reaching a minimum of $100 per barrel for oil and
$10 per gallon for gasoline before the end of this decade.
Oil and gas prices will rise and fall in the future as they have done in the
past due to economic and political factors. Geology will play a role in prices
only if it influences the supply-demand relationship — if petroleum companies
are unable to find more oil, replace their reserves and meet the world’s
rising demand. Thus, watching the geological climate is vital in the coming
years to verify whether we are hearing another wolf crying or if the wolf is
really here.
Sorkhabi is a research
professor at the Energy and Geoscience Institute at the University of Utah,
Salt Lake City.
Back to top
Book Review
 |
Our Affair with El Niño
by S. George Philander. Princeton University
Press, 2004. ISBN 0691113351. Paperback, $26.95.
|
Uncertain weather
Edward S. Sarachik
Every few years, including this year, we read in the newspapers that another
El Niño is on its way, and depending on where we live, we start attaching
our previous experiences to this information. People in Australia expect drought,
and people in California expect heavy rains. In many cases, these expectations
are based on two particularly large recent events — in 1982 to 1983 and
1997 to 1998 — that seem to have imprinted those years’ weather on
people’s minds. The reality is much more complicated and much more interesting.
What is actually happening is that the warm sea-surface temperature in the western
tropical Pacific, normally on the order of 29 degrees Celsius, begins to spread
eastward into the central and eastern Pacific (normally a few degrees colder)
and allows the regions of persistent precipitation to spread considerably eastward
of their normal positions over the warmest water in the western Pacific. The
ocean manifestation is warmer water, and the atmospheric expression is increased
precipitation and lower surface pressure both spreading into the eastern Pacific.
The combined atmosphere-ocean phenomenon has come to be known as the El Niño/Southern
Oscillation, or ENSO. Because regions of persistent precipitation in the tropics
excite waves that can reach north and south far from the tropical regions, some
regions tend to get drier and warmer, and some tend to get wetter and cooler.
The signal is not overwhelming and can be masked by the natural climate variability
of the region.
While vast regions of the ocean go unobserved, the equatorial Pacific is particularly
well-measured by a set of about 70 bottom-anchored surface moorings deployed
jointly by the United States and Japan. We not only know the state of the upper
ocean, but we also know the winds and temperatures of the near-surface atmosphere.
All the data are freely available and the state of the equatorial Pacific is
viewable online any day of the week (www.pmel.noaa.gov/tao).
The data are used as initial conditions for coupled atmosphere-ocean models,
which then proceed to give skillful (but not infallible) predictions of the
future state of ENSO. In many ways, the development of this ability to predict
months in advancethese aspects of future climate is one of the most remarkable
stories in geophysics. Much of it is told in S. George Philander’s new
book, Our Affair with El Niño.
This book, written primarily for the nonscientist, not only deals with the physical
mechanisms of the warm and cold phases of ENSO (often called El Niño
and La Niña, respectively) and its far-flung manifestations throughout
the world, but also deals with a bewildering number of additional topics. Its
purpose is “to help improve communication between scientists and nonscientists
by taking advantage of the intense interest everyone takes in El Niño.”
The author, a professor at Princeton University who has studied ENSO since the
1960s, thus takes the opportunity to make some wise statements about the differences
between science and policy approaches to societal problems, such as global warming.
The result of this discussion is the old question: “How much certainty
do we need to act?” This is a policy question rather than a scientific
one, and it is disingenuous of policy-makers to constantly insist on more certainty
when the consequences of delay could be harmful. As geoscience is not an experimental
science, questions of causality or attribution can never be answered without
uncertainty.
In the book, Philander also presents a history of the science of weather, weather
prediction and oceanography; explains the sensitive dependence of most evolving
physical phenomena on initial conditions; and describes the last 60 million
years of Earth’s climate. A renaissance man, Philander also talks knowledgeably
about painting, poetry and music, among other subjects.
Overall, despite the wide variety of topics, the writing is usually interesting,
though sometimes insufferably precious (especially in the “I am a cloud”
chapter). The book is as wide-ranging and unclassifiable as its author and is
worth getting to know.
Sarachik is a researcher with the Center for Science in the Earth System at
the University of Washington, Seattle.
Back to top
Mapping
Digital Mapping in Kentucky
On April 30, the Kentucky Geological Survey (KGS) celebrated a milestone in digital
geologic mapping: It has completed the digital compilation of all 707 geologic
quadrangle maps in the state. This represents one of the most detailed digital
mapping projects of any place on Earth’s surface. Already, many federal and
state agencies, as well as private industries, have sought this digital data for
environmental, mapping, planning, land-use, engineering and exploration purposes.
“In Kentucky, we have a proud legacy,” KGS Director Jim Cobb said in
a press release. “In 1978, Kentucky became the first state of large size
in the nation to achieve complete detailed geologic map coverage. We are now the
first state in the nation to have complete digital geologic map data for the entire
state. This provides an incredible foundation of geologic information that is
easily accessible, inexpensive, and widely distributed for the benefit of future
generations of people in the commonwealth.”
Originally produced as paper maps between 1969 and 1978 as part of a cooperative
geologic mapping project between KGS and the U.S. Geological Survey, the project’s
economic return to society from the investment of government funds for the original
program was between 25 and 39 times greater than the program costs. Now, the KGS
Digital Geologic Mapping Program provides complete digital geologic map coverage
at a scale of 1:24,000. In 2005, these maps will be compiled into 32 individual
1:100,000-scale geologic maps by matching the edges of each quadrangle boundary
with the adjacent quadrangles. The project was supported by the USGS National
Cooperative Geologic Mapping Program and other state funding.
In the process of compilation, KGS is creating a database of geologic information
called Digitally Vectorized Geologic Quadrangles (DVGQs). Many of these DVGQs
have already been released to the public via CD-ROM, and Internet availability
is planned for the future. The DVGQs dataset is the basis of many future products.
The KGS Web site (see link below) has a status map showing quadrangles currently
available. Contact KGS publication sales at 859-257-3896 or e-mail KGS-Pub@lsv.uky.edu
for more information on these new products.
Warren Anderson contributed to the Maps section this
month and is the principal investigator of the Digital Geologic Mapping Project
for the Kentucky Geological Survey. E-mail: wanderson@uky.edu.
Link:
Kentucky
Geological Survey
Back to top
Untitled Document

 The
End of Oil: On the Edge of a Perilous New World
 The
Oil Factor: Protect Yourself — and Profit — from the Coming Energy
Crisis
 Out
of Gas: The End of the Age of Oil
 Hubbert’s
Peak: The Impending World Oil Shortage
 The
Party’s Over: Oil, War and the Fate of Industrial Societies


