
 The
U.S. government, as the insurer of last resort, is becoming increasingly vulnerable
to the costs of natural disasters through disaster declarations and spending
by the Federal Emergency Management Agency (FEMA). The number of presidential
disaster declarations has generally increased over the last half century, since
the federal government has assumed continuous responsibility for disaster aid.
The federal government’s costs for natural disasters are increasing both
in terms of the federal budget and the gross domestic product (GDP).
The
U.S. government, as the insurer of last resort, is becoming increasingly vulnerable
to the costs of natural disasters through disaster declarations and spending
by the Federal Emergency Management Agency (FEMA). The number of presidential
disaster declarations has generally increased over the last half century, since
the federal government has assumed continuous responsibility for disaster aid.
The federal government’s costs for natural disasters are increasing both
in terms of the federal budget and the gross domestic product (GDP).
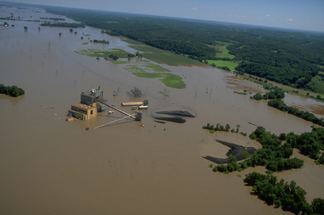
In July 1993, flooding on the Mississippi
River wreaked havoc in Missouri. A total of 534 counties in nine states were
declared federal disaster areas, and 168,340 people registered for federal assistance.
Federal disaster aid has been on the rise over the past 50 years for hazards,
including floods, hurricanes and earthquakes, as disaster response and mitigation
efforts inadvertently have encouraged development in high-risk areas. Image
by Andrea Booher/FEMA Photo.
Even when accounting for the exponential rise in GDP over the last four decades,
costs of natural disasters as a percentage of GDP have more than tripled. This
figure does not include the recent costs from Hurricane Katrina, which will
most likely be the most expensive disaster in U.S. history, and has raised fundamental
questions about high-risk land use.
The costs of natural disasters are driven by relatively few events —
fewer than 1 percent of disaster declarations are responsible for the majority
of costs. To reduce our nation’s exposure to natural disasters, we need
to determine what factors cause these few events to be so expensive.
In general, the increase in cost correlates strongly with the large increases
in population and wealth in disaster-prone areas — in particular, East
Coast regions vulnerable to hurricanes and West Coast regions vulnerable to
earthquakes. By directly comparing disaster costs with local infrastructure
costs, event size and event frequency, however, more subtle relationships emerge.
Earthquakes, hurricanes, tornadoes and floods vary in frequency and impact,
but all have the capability of inflicting great damage and incurring high costs
to the federal government. U.S. hazard mitigation efforts and disaster relief
policies may inadvertently be contributing to these increased costs by making
us more vulnerable to expensive low-probability, high-cost events. The political
and social forces that support these counterproductive policies will require
a national change in how we perceive these disasters — a change that hurricanes
Katrina and Rita may help initiate.
Hurricanes
In the last century, more than 170 hurricanes have hit the United States. Each
year in the Atlantic, approximately six hurricanes form, with one or two making
landfall on the United States. Hurricane frequency, strength and location are
affected by wind shear and sea-surface temperatures, both of which are part
of the greater El Niño-Southern Oscillation and multi-decadal cycles
and patterns.
Despite this year’s highly active Atlantic hurricane season, there does
not appear to have been a significant increase in either the occurrence or the
severity of hurricanes over the last century; El Niño and La Niña
provide an explanation for which years have more or fewer. During an El Niño
phase, the sea-surface temperature anomaly in the Pacific Ocean is high, and
the number of storms in the Atlantic is low (in 1983 for example). During La
Niña (the opposite of El Niño), the anomaly is low and the number
of storms is high (in 1988 for example).
Hurricanes are complex events, having a diverse set of factors that drives damages
in the areas they strike. Wind speeds, intense rainfall, coastal storm surges,
unpredictable paths and varying travel speeds are among the characteristics
that, together, define each hurricane event. In general, the physical and temporal
uniqueness of each hurricane event mean that a large portion of the cost is
the result of coincidental damages. Katrina, for example, would not have generated
so much flooding if it had not moved so slowly over the coastal areas it affected.
The quantifiable storm characteristic that is most strongly correlated with
FEMA spending is population density in the county where landfall occurred for
large events, of Category 3 or higher on the Safir-Simpson scale.
Hurricanes typically strike coastal areas with strength, but weaken quickly
after making landfall. Coastal areas, already at risk of storm-surge flooding,
are therefore subject to more forceful winds. Increases in sea level, the inevitable
landward migration of East Coast barrier islands and the continued population
shift to coastal areas on the East Coast — which includes building high-value
beachfront property — result in higher damage costs from hurricanes that
make landfall, though the number of storms has not been increasing.
The more typical and less severe Category-1 or 2 events, which are not hugely
different from a harsh rainstorm, show little or no correlation between FEMA
spending and population density at landfall. The more forceful (and rare) events,
as with earthquakes above magnitude 6.0, show a strong correlation between FEMA
spending and population density.
Earthquakes
Between 1989 and 2004, more than 180 earthquakes of magnitude 5 or greater have
struck in the continental United States. U.S. presidents have declared 11 of
these events disasters.
As with hurricanes, earthquake costs are determined by the population impacted.
The relationship between cost and population becomes apparent by comparing earthquake
size and population density between 1989 and 2004. When FEMA awarded money to
an area with a moderate or high population density (200 to 1,800 people per
square mile) affected by an earthquake of a magnitude greater than 6.5, the
funding increased with the population density irrespective of the magnitude
of the event (for example, the Northridge, Loma Prieta and Olympia quakes).
When FEMA awarded money to an earthquake-affected area with low population density
(20 to 200 people per square mile), the funding scaled with the magnitude of
the event (for example, the Landers, Petrolia, San Simeon, Clackamas, Napa and
Plattsburgh quakes). When FEMA awarded money to an earthquake-affected area
with a very low population density (between 0 and 20 people per square mile),
the funding was small — approximately $5 million — irrespective of
the magnitude of the event (such as with the Denali and Klamath quakes).
Tornadoes
Between 1989 and 2004, 155 disaster declarations have included the word “tornado”
in their description. The size of tornadoes is described by the Fujita scale
F0 to F5 (similar to the magnitude of an earthquake or the category of a hurricane).
A dramatic increase in reported F0 events occurred in the late 1980s, due to
the introduction of Doppler 88-D surveillance radar (see story,
this issue); more events were detected and therefore more reported. After
removing the F0 events, the frequency of tornadoes over the last 20 years shows
no increase.
Most tornadoes occur in the central United States, where population densities
are low (between 20 and 200 people per square mile) and relatively uniform.
Tornadoes are also short-lived and affect only small areas. For a tornado to
incur a high cost, it must occur along with significant flooding, or be a unique
event in terms of what it destroys. On March 14, 1997, for example, an F5 tornado
destroyed an airplane hangar in Kentucky containing expensive aircraft, and
in another case, on May 4, 1999, an F5 event included a cluster of 94 tornadoes
occurring over two days in the Oklahoma City region.
In contrast to earthquakes and hurricanes, which are low-frequency, high-cost
events, tornadoes exemplify high-frequency, low-cost events. Tornado events
are similar in cost — typically less than $25 million — because they
occur frequently in areas of moderate to low population density.
Floods
Because of the complex nature of rivers and their drainage basins, defining
one standard that successfully measures a flood is difficult. No scale exists
for floods that is similar to the magnitude scale for earthquakes, the Fujita
scale for tornadoes or the category system for hurricanes. Recurrence intervals
are used to measure the size of a flood, but the measurements are unique to
a drainage basin and do not allow comparisons among different drainage basins.
More than 85 percent of U.S. counties have been declared federal disaster areas
due to floods in the past 50 years. With increasing development in floodplains,
less soil is available to soak up water, and flooding occurs more easily than
ever. Floods are such high-frequency, ubiquitous events that much has already
been done to ameliorate effects of common flooding disasters. On a local scale,
the cost-effectiveness of further flood control measures is questionable, especially
in areas not normally prone to flooding. On a national scale, however, floods
constitute a high portion of FEMA’s disaster obligations.
The 20 most expensive floods in the United States show that costs roughly depend
on population density. However, five of these 20 floods do not follow this trend.
These outlying events are either extremely large, such as the Mississippi River
flood in 1993, or occurred in areas unprepared for a flood, such as Detroit,
Mich., in 2000. As with tornadoes, the relationship suggests that the driving
factor of the cost of expensive floods is the unusual nature of the event with
regard to its magnitude or its location.
Politics
 For extreme
events, disasters can also be a test of governments, as the world has witnessed
with Hurricane Katrina. Disasters can bond a community and provide opportunities
for politicians to demonstrate leadership. In fact, political support for incumbent
politicians commonly increases following a disaster. Conversely, if a government
fails to respond properly, disasters can also foment political unrest. On a
small scale, they can change public opinion of a leader, as illustrated by polls
that showed lower approval ratings of President Bush following Katrina. And
on the larger scale, they can even result in the overthrow of governments, as
in the case of the 1972 Managua earthquake, when the vast destruction contributed
to the unrest that eventually led the Nicaraguan people to oust General Somoza.
For extreme
events, disasters can also be a test of governments, as the world has witnessed
with Hurricane Katrina. Disasters can bond a community and provide opportunities
for politicians to demonstrate leadership. In fact, political support for incumbent
politicians commonly increases following a disaster. Conversely, if a government
fails to respond properly, disasters can also foment political unrest. On a
small scale, they can change public opinion of a leader, as illustrated by polls
that showed lower approval ratings of President Bush following Katrina. And
on the larger scale, they can even result in the overthrow of governments, as
in the case of the 1972 Managua earthquake, when the vast destruction contributed
to the unrest that eventually led the Nicaraguan people to oust General Somoza.
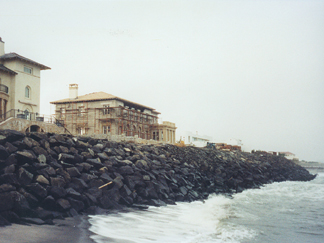
This seawall was built to protect homes
from migrating coastlines along the New Jersey shore. Such mitigation practices
against moderate hazards (supported with federal funds) can result in making
regions more vulnerable to large hazards, as it not only leads to the loss of
the beach, but also encourages the development of expensive infrastructure in
high-risk areas. Image courtesy of Gregory E. van der Vink.
In the United States, usually the governor of the affected state makes a formal
request for FEMA assistance. Because a presidential disaster declaration is
required before FEMA can provide an area with federal disaster relief funding,
political factors can be introduced into the process. Based on records from
1952 to 2002, whether the U.S. president and the state governor shared a party
affiliation had no significant effect on whether a disaster declaration would
be approved or turned down. Furthermore, Republican and Demo-cratic administrations
have similar approval and denial rates.
Although party politics do not seem to play a major role in disaster funding,
almost every election year shows a small spike in the number of disaster relief
requests approved — particularly when the incumbent is running for reelection.
Meeting symbolically with disaster victims and approving requests for disaster
funding are attractive opportunities for a candidate to improve his or her public
image. The minor year-to-year political fluctuations are small, however, when
viewed in the context of the overall increase in disaster declarations with
time.
Opportunity for change
The timescale of human experience is short compared to the recurrence interval
of many natural phenomena. While we develop infrastructure resilient to common
events, such as routine seasonal weather, we remain vulnerable to those events
that occur less frequently or over longer timescales. For example, a 6-inch
snowfall in Boston, where such storms occur annually, has much less impact than
a 6-inch snowfall in Washington, D.C., where such storms occur only once a decade.
 When
considering events that garner a FEMA disaster declaration, two cost-frequency
trends emerge. Earthquake and hurricane disasters are generally high-cost, low-frequency
events, whereas tornado and flood disasters are low-cost, high-frequency events.
The common factor for high cost is the extent to which the disaster is unusual
— either in terms of its recurrence interval or its size. In other words,
rare events such as earthquakes and hurricanes just need to happen in populated
areas to be costly. More frequent events, such as tornadoes and floods, need
to be unusually large or to occur in areas where they usually do not occur.
When
considering events that garner a FEMA disaster declaration, two cost-frequency
trends emerge. Earthquake and hurricane disasters are generally high-cost, low-frequency
events, whereas tornado and flood disasters are low-cost, high-frequency events.
The common factor for high cost is the extent to which the disaster is unusual
— either in terms of its recurrence interval or its size. In other words,
rare events such as earthquakes and hurricanes just need to happen in populated
areas to be costly. More frequent events, such as tornadoes and floods, need
to be unusually large or to occur in areas where they usually do not occur.
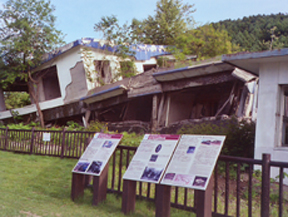
The government of Japan maintains this house, destroyed by a volcanic eruption,
as a reminder to improve awareness of such low-probability high-impact events.
Image courtesy of Gregory E. van der Vink.
In the United States, the increase in costs to the federal government is most
likely an unforeseen consequence of our own disaster management policies. Mitigation
strategies require public support; public support requires awareness; and awareness
usually requires the occurrence of an event. As a result, resources are almost
always available to respond to the last event, but rarely to mitigate against
the next. We tend to view natural disasters as random unfortunate acts, rather
than the predictable consequence of high-risk land use. As a result, we rebuild
communities in the same high-risk areas — thus inadvertently using taxpayer
dollars to put more people in harm’s way.
In many cases, the influx of federal assistance and rebuilding can actually
boost the local economy — resulting in more infrastructure and increased
population in these high-risk areas. Such efforts may, themselves, then become
responsible for increased costs. Whether it is cost-effective for communities
to maintain a state of readiness for low-probability events, such as a “storm
of the century” or even a “storm of the decade,” is questionable.
Mitigation against moderate events can make us more vulnerable to large events.
For example, a levee may be enlarged to handle a 100-year storm rather than
a 50-year storm. If the net result of the rebuilding is four times as many people
move into the area, the risk ends up increasing. Paradoxically, our mitigation
efforts, like our response efforts, subsidize such high-risk land use as living
on migrating barrier islands, in floodplains or on active fault zones.
Consequently, we are becoming more vulnerable to low-probability events. For
any specific individual city, this short-term solution is politically and, with
federal disaster relief, economically attractive. When such an approach is adopted
across a nation, however, the result increases already large costs to the federal
government.
Population trends, mitigation efforts and federal disaster relief policies all
contribute to encouraging high-risk land use and ultimately to making our society
more vulnerable to the costs of natural disasters. Hurricane Katrina has created
an opportunity to change this trend at the national scale. If New Orleans is
built to accommodate the inevitable next extreme hurricane, it will set an example
for future land-use management and urban planning. Absent such change, the costs
of natural disasters, and the government’s liability, will simply continue
to increase as we place more people and infrastructure in harm’s way.
|
Forecasting
hurricane damages |
 |
Geotimes Home | AGI Home | Information Services | Geoscience Education | Public Policy | Programs | Publications | Careers |