|
 Subscribe

GEOMEDIA
Geotimes.org offers each month's book reviews, list of new books, book ordering information and new maps.
Check out this month's On the Web links, your connection to earth science friendly Web sites. The popular Geomedia feature is now available by topic.
Movies: Footprints: Flexing the rules of filmmaking
Maps: Mineralogy 101: Photo-Atlas of Minerals 2.0
Maps: Earth, interactive: This Dynamic Planet
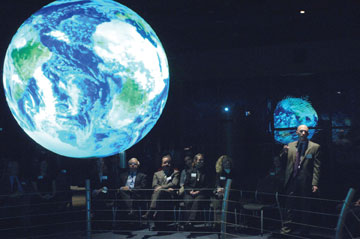 |
| Audiences of Footprints watch as storms develop around the globe or as city lights illuminate the world. For now, Footprints is playing at select science centers that have Science on a Sphere set up. Photograph is courtesy of NASA/Debora McCallum. |
NASA-TV executive producer Michael Starobin is thinking outside the box — literally: Instead of projecting films onto a traditional flat, rectangular screen, Starobin projects his latest creations onto a sphere. Now, Footprints, Starobin’s first film produced exclusively for the sphere, is changing the way movie-going audiences view the solar system.
At the Dec. 7, 2006, world premier of Footprints at the Maryland Science Center in Baltimore, audience members gathered in seats encircling an orb suspended from the ceiling. The 16-minute film took the audience on a narrated, musical exploration of the dynamic Earth. Like astronauts in space, the audience watched the 1.7-meters-diameter replica of Earth as hurricanes developed and city lights overtook the night sky. The moon also took the stage for a time, as did Mars.
Science on a Sphere, as the globe and projection system is called, debuted in 2002 at a separate government agency. The idea belongs to the director of NOAA’s Earth System Research Laboratory in Boulder, Colo., Alexander MacDonald, who created the system for NOAA to display planetary data in a new, realistic way. Maps hanging in schools and offices are often distorted when images of the globe are stretched to fit into a flat rectangle. Project that map onto a globe, however, and area and distance information is accurately retained.
MacDonald and colleagues collected data previously mapped by NOAA, from weather events to light pollution, and devised a system of computers to splice the maps into quarters. Next, four projectors, each placed 90 degrees apart, project the images, which conform to the globe’s otherwise white surface.
At first, images projected were still, but MacDonald and colleagues advanced the technique by projecting sequences to animate the images, similar to a flip-book, Starobin says. “It’s pretty spectacular to see clouds moving across Earth, or a hurricane,” he says.
Still, there remained no way to edit the images, such as cut, wipe, pan and orient, as is done in traditional movies and television. “Not only are we denied all of the basic rules of filmmaking, but we’re also denied powerful contextualization options so that that data, and those images, will have relevance to people who are not experts in the subject,” Starobin says.
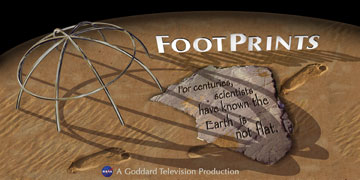 |
| Footprints is a new NASA film created specifically for a spherical “screen” called Science on a Sphere. Image is courtesy of NASA/TISB/Debora McCallum. |
The problem first plagued Starobin in fall 2005, after NASA purchased a sphere from NOAA and assigned him to find out if the system could portray NASA data. “We seem to do pretty well with planets, and it’s a planet-shaped screen, so write something,” Starobin says he was told. At first, Starobin planned to create the equivalent of a spherical PowerPoint slide of still images. But Starobin began to wonder if he could take the spherical medium a step further by applying traditional film-editing techniques to the images.
Working with the scientific visualization lab at NASA Goddard Space Flight Center in Greenbelt, Md., Starobin found that, indeed, new code could be written into software that allows the filmmaker to alter the planet’s tilt and rotation speed. Thus, the “race began,” he says, to create the film Footprints and prove to NASA that the new technology is worth the time, effort and financial investment.
Production on Footprints began in February 2006 and the film was released to the world on May 4. During the three intervening months, there was “off the charts insanity,” Starobin says, as the team tried to find out what works and what doesn’t work when making a film for a sphere. The use of the sphere to depict entire planetary processes “is very exciting for planetary science,” Starobin says. “But most science does not require an entire planet.”
The team ran into several challenges that drove them to create a new cinematic vocabulary. The “problem of chair,” for example, relates to the problem of distortion. Film a chair for a traditional movie and audiences understand that the object is a chair, and that zooming in on the chair emphasizes the chair’s importance. Zoom in on a chair portrayed on the sphere, however, and the chair “loses its chairness,” Starobin says, as it conforms to the sphere and stretches over the poles. “It’s not that you must avoid subjects that concern chairs, you must come up with new vocabulary to relate the concepts,” he says. “You can’t rely on age-old cinematic devices like zooming in.”
And then there’s the “problem of egg,” which relates to issues associated with depth. Starobin initially wanted to compare the cross section of an egg with Earth and its core. Only audience members directly in front of the egg would be able to perceive its depth, however, while others would perceive only a smear of color. “The ‘problem of egg’ precludes an easy description of depth,” he says, “You’ve thrown out the window one of the fundamental discoveries of painting in the last 700 years.”
Alongside such limitations, however, Science on a Sphere offers unique possibilities for increasing dramatic effect. For example, a simple special-effects shot transforms the moon from young and smooth to old and cratered — a scene that always fetches “big wows” from the audience, Starobin says.
Beyond new challenges posed by the sphere, Starobin and colleagues have to think about traditional means of cinematic communication, such as creating an engaging script and score. “In many ways it would not be a relatable subject if it weren’t for these common words and music.”
Although the traditional metrics of success for a movie or TV show, such as box office receipts and ratings, are not available for Footprints, Starobin says the film has been a success. In November 2006, Time magazine named Footprints one of the best inventions of the year.
At the end of 2006, 10 museums and educational institutions owned a Science on a Sphere device. That number should increase, Starobin says, adding that he has also seen “intense interest” for more content. Proposals to NASA for additional films are already in the works, although what comes next depends on issues of NASA funding. For now, check the NASA Goddard Web site to find out where Footprints is playing on a sphere near you.
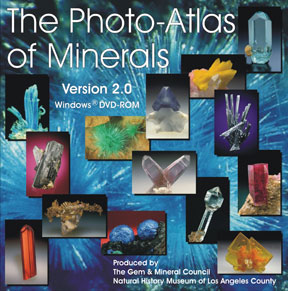 |
| The Natural History Museum of Los Angeles County has re-released its Photo-Atlas of Minerals via a new DVD. Mineral buffs and mineralogy students alike will get something out of this comprehensive DVD. Image is courtesy of Natural History Museum of Los Angeles County. |
Quick: Name a whitish, hexagonal mineral with a glassy luster. And it’s not quartz.
If you guessed calcite, you’re right — but that’s an easy one. If you aren’t familiar with such minerals as inesite, chrysocolla or wulfenite, you may find the mineral-identification game on the Natural History Museum of Los Angeles County’s new Photo-Atlas of Minerals 2.0 DVD tough going.
For those who are really stumped, however, the designers of the Photo-Atlas have created a DVD that brings information about thousands of minerals to the fingertips. For a few more clues to an elusive mineral’s name, request information about the mystery mineral’s hardness, specific gravity or crystal system, and then browse the Photo-Atlas’ vast, easily searchable database for matches.
An update of an earlier CD-ROM version, the new DVD contains information on more than 4,100 minerals, with more than twice as many pictures as the previous version, totaling about 16,000 high-quality images that will appeal to professional and amateur geologists alike. The database includes not only classic mineralogical identifiers such as streak and luster, but also the origins of the minerals’ names (and audio files to help with pronunciation) and preset slideshows of specimens (such as gemstones or fluorescent minerals).
The Photo-Atlas’ intended audience “is pretty broad,” says Anthony Kampf, curator of Mineral Sciences at the museum and lead developer of the DVD. “We expected [the original Photo-Atlas CD-ROM] to appeal to the mineral collector, but we also found a lot of people in academics used it in the classroom.” For that academic audience, he says, the DVD now includes additional mineral information, such as atomic structures and crystal drawings.
In addition to an expanded database of minerals, new mineral information and higher-resolution images, features that are new to the DVD include the ability to upload your own favorite mineral images and create custom slideshows — the better to show off a carefully hoarded, backpack-weighting summer collection to family and friends.
The DVD can be ordered online from the Photo-Atlas’ Web site (http://www.nhm.org/pam) at a cost of $59.95 plus shipping for new users and an upgrade price of $39.95 plus shipping for previous CD purchasers. Users who have purchased the DVD can also download free updates from the Photo-Atlas’ Web site.
Links:
Photo-Atlas of Minerals Web site
Stand back and admire how powerful geological forces shaped the entire surface of Earth, or zoom in and marvel at the beauty of a single volcano: both are possible with the latest edition of This Dynamic Planet, a geologic map available both on paper, for classroom or office display, or online, as an interactive Web tool.
Five years in the making, the new map, created jointly by the Smithsonian Institution, the U.S. Geological Survey and the U.S. Naval Research Laboratory, builds on the two previous editions of This Dynamic Planet, released in 1989 and 1994. The third, 2006 edition, includes updated and new locations for more than 1,500 volcanoes, 44,000 earthquakes and 170 impact craters, plotted against high-resolution land and seafloor topography.
The map also has an entirely new “reverse” side — no longer blank, it is now packed with geological information on plate tectonics, meteor impacts and hotspots, and it includes a timeline that tracks the changing face of Earth from 550 million years ago to present, and even 50 million years into the future. This latest edition of the map far more than a “snapshot” of present-day Earth, demonstrating that “these forces have been at work for billions of years, and are going to continue,” says Tom Simkin, a volcanologist at the Smithsonian Institution and the lead designer of the map.
The new edition also reflects the last decade’s improvements in seismologists’ ability to more precisely pinpoint earthquake locations. For example, the new map shows that the earthquakes at the Atlantic mid-ocean ridges are actually clustered at the side-slip transform fault segments of the ridge, rather than located along the spreading centers — far more accurately reflecting the geology, Simkin says.
Building further on this information, the interactive map, found on the Smithsonian’s Web site (http://www.minerals.si.edu/tdpmap/), allows users to zoom in and out of different regions and select different “layers” of information to superimpose on the map, such as volcano locations, plate names or plate motions. Although virtual globes such as Google Earth also allow users to select information layers, “our datasets are far more selective,” Simkin says, showing, for example, a variety of types of volcanoes rather than just one, and both the magnitude and depth of earthquakes, rather than just their locations.
The interactive Web-based map also allows users to take advantage of the high-resolution mapping techniques the designers used to recreate Earth’s topography, offering a resolution of about one kilometer. At that scale, it is possible to see individual volcanoes, says Paul Kimberly of the Smithsonian Institution, who served as webmaster for the interactive map. To map the seafloor, the map’s creators used satellite radar altimetry to capture small movements of the sea’s surface that reflect underlying mountains and valleys, as well as ship-based acoustic techniques to collect higher-resolution data.
Designed to be useful to anyone from eighth grade “and up,” the map’s designers hope it will not only be displayed in high school classrooms, but that geologists will also want it to spruce up their offices, Kimberly says. Furthermore, he says, with its detailed geological background information on how new crust forms, how mountains can build and how volcanoes and earthquakes cluster at converging plate boundaries, “it’s perfect for college.”
The two-sided paper version of This Dynamic Planet can be ordered online from the Smithsonian’s Web site, for $14 plus a $5 shipping cost, and is also available for $15 at the National Museum of Natural History’s museum shop in Washington, D.C. Visitors to the Smithsonian’s Web site can freely use the interactive Web-based map.
Links:
This Dynamic Plant Web site