
|
 Subscribe

Earth science friendly Web sites
Archived features by topic:
General
Reference
Education
For
Kids
Jobs
Atmosphere
Caves
Energy
Environment
Mapping
Oceans
Paleontology
Plate
Tectonics
Polar
Regional
Geology
Rocks/Minerals
Space
Water
last updated 8/1/08
scientistswithoutborders.nyas.org
Fitnat Yildiz, a researcher at the University in California at Santa Cruz, is searching for stool samples from people infected with cholera. She would like to test whether wild strains behave the same way lab strains do — an analysis that can be difficult to conduct in areas of the world where cholera thrives. Normally she meets the scientists who can access such samples at conferences. But now she has a new way of finding them — an online database created by a new initiative called Scientists Without Borders (scientistswithoutborders.nyas.org). Using the database, Yildiz can search for people who have samples, or she can post an ad indicating her need.
The Scientists Without Borders database, hosted by the New York Academy of Sciences, is an attempt to address a pervasive problem: lack of collaboration. “People working in developing countries often don’t know what others have done or what they’re doing,” says Evelyn Strauss, the initiative’s executive director. When Strauss asked people in Africa what common mistakes they see aid organizations making, the response she heard over and over again was “reinvention of the wheel.” So she and her colleagues created a database that not only gives people a sense of what work is going on where, but that also allows people who have particular resources or skills to find the organizations and projects that need them.
In some ways, Scientists Without Borders is similar to other professional networking sites, such as LinkedIn or Facebook. Participants create free profiles that describe their professional interests and background. Others can view those profiles and make contact through e-mail or phone.
In other ways, though, it’s completely different. Those wishing to join must be involved in a science-related activity — anything from medical sciences to seismology — and have an interest in helping people in the developing world. To ensure that participants meet those qualifications, only those who are invited can join. Would-be participants can secure an invitation through someone who is already a member, or they can request an invitation by answering a few questions on the Web site. The invitation requests allow Strauss and her colleagues to verify that people are who they say they are and that they are doing work or want to do work that fits the mission.
Joining Scientists Without Borders may be a little more difficult than joining Facebook, but the payoff is manifold. Members don’t have to be “friends” to see each other’s information and they have some assurance that the profiles represent real people with real expertise.
Scientists Without Borders is more than just a networking site. One of its goals is to match people who have resources with people who need them. Because while Craigslist connects a person needing a couch with a person selling a couch, it’s unlikely to help geophysicists at Istanbul Technical University in Turkey, for instance, find the seismometers and seismology instructors it is searching for.
So far, the database, which was launched May 12, boasts 140 organizations, 82 projects and 419 individuals, including a biochemist in Argentina, a geophysicist in Cuba and an astronomer in India. That’s not bad given that Strauss has relied mainly on word of mouth. “The whole thing is based on viral marketing,” she says. But recruitment is far from passive. She and her colleagues actively seek partners to help spread the word. “The database will be as useful as the extent to which it’s populated with quality information,” Strauss says.
Strauss looks forward to seeing membership expand, but she’s thinking beyond sheer numbers. “I’m interested in success stories,” she says, “examples of connections that wouldn’t have been made without the site.”
 Image provided by SciVee |
| A scientific alternative to YouTube, the new Web site www.SciVee.tv puts scientists in front of the camera. |
YouTube has made it easier than ever to quickly earn 15 minutes of worldwide fame, but sorting through the resulting millions of videos on the site for something worthwhile to watch can be exhausting. Enter a new Web site: www.SciVee.tv, where science-oriented Web surfers can bypass the lip sync videos and homemade diaries on chaotic sites like YouTube, and instead upload and watch videos made by scientists, for scientists and about scientists.
Cofounder Phil Bourne, a pharmacologist at the University of California at San Diego, says he got the idea while watching his students immersed in their computers, headphones on. “I’d look over their shoulders and half the time they’re watching YouTube,” Bourne says. “And I thought, why aren’t we doing science this way?”
But after uploading a few scientific videos to the well-trafficked site — and finding one posted just below a video featuring four male Austrian dancers — Bourne came up with another idea: a brand-new, science-only site, dubbed SciVee. The site was launched last fall with the help of a National Science Foundation cyberinfrastructure grant.
Originally, the plan was to just do “pubcasts,” short videos in which a scientist with a newly published, peer-reviewed paper would describe his or her research and possibly provide a few graphics to spice up the visuals. In part, Bourne says, the idea to do science pubcasts was prompted by his support for public-access research (the Public Library of Science is a partner in the site); he envisioned SciVee as a place to further disseminate scientific knowledge and attract more attention to scientific papers. Additionally, he says, a 10-minute briefing on a research paper could be a big help to scientists struggling to keep up with the thousands of papers that are published every week.
Once started, however, the site took on a life of its own. For one thing, Bourne says, scientists have been a bit shy about doing pubcasts, although as the site gains viewers and exposure, the idea is starting to catch on. Additionally, he says, “there was all this great video content at labs and institutions, and we wanted to post that and start a video section too.”
Therefore, in addition to the scientist-produced pubcasts describing a single research paper, the site now includes a large collection of more broadly focused videos, ranging from the relatively polished, lively short episodes of “Dr. Carlson’s Science Theater,” (science subjects explained by a high school science teacher), to informative briefs on broad scientific topics (such as plate tectonics) to conference-type Powerpoint presentations. The pubcasts are what make the site truly unique, however. One of the earliest pubcasts — an eight-minute discussion of the structural evolution of the protein kinase — has been accessed 75,000 times in the few months since the site launched, Bourne says. “It’s not a topic that you’d think would capture a lot of people’s interest,” he says. However, the medium itself is “quite vital,” he adds. “Video is an immersive environment.”
SciVee’s founders say that they have bigger ideas in mind than just providing a scientific alternative to YouTube, however. They want to create a new kind of community — one that helps level the playing field and gives more visibility to younger scientists and students. “Science is very hierarchical,” Bourne says. “But these videos bring the younger people in the lab, the ones really doing [a lot of] the work, to the front. They’re the ones more likely to view and to make the content.” The SciVee team has also created professional development videos for grad students, as well as brief informative videos such as “Ten Simple Rules for Getting Grants.” And one future plan is to give glimpses into scientific labs, where prospective students (or curious viewers) can watch the lab’s principal investigator in action and learn about what the lab does. “It puts a very human face on science,” Bourne says.
Although the video content spans many fields of science, biologists still dominate SciVee.tv’s pubcasts, largely because of the site’s ties to the Public Library of Science, which now routinely invites authors of its accepted papers to create a pubcast. But Bourne and his team hope that as word gets out, scientists from all fields will want to participate. The only criteria for making a pubcast about a paper, he says, are that the research must be peer-reviewed and the scientist’s coauthors must be given a fair chance (about five days) to nix the idea.
Currently, the pubcasts are simple straightforward summaries of a paper, but the founders have plenty of ideas to spruce them up in the future. “If it’s an open-access publication, we could integrate the video with the publication — that’s the essence of the pubcast,” Bourne says. “As the person talks, the appropriate bits of the paper they’re talking about pop up, or are highlighted.” Other ideas include more interview-type pubcasts, an open review system offering comments and ratings and perhaps live webcast sessions with scientists taking questions.
With so many new ideas, the site is still in an experimental “beta” phase, and will be for some time, he says. The team is evaluating everything from the length and format of the videos to who is watching to figure out how to draw in new people, both to create content and to view it. "We're experimenting," Bourne says. "And it almost feels like we’re rediscovering public broadcasting, the early days of television — the medium’s just different.”
www.earthlab.com/life/Food.aspx
Perhaps you know him for his bright red hair and orange clogs, or his twelve restaurants (and counting), or his five cookbooks including titles such as Simple Italian Food or Mario Tailgates NASCAR Style, or his multiple appearances on the Food Network in Molto Mario or on Iron Chef America. But however you know Chef Mario Batali, you probably didn’t know that he recently paired with EarthLab (www.earthlab.com/life/Food.aspx) to produce an environmentally friendly food and wine pairing Web site.
The site, part of EarthLab’s Life series that includes all kinds of home and wellness environmental tricks, includes “green” cooking tips — everything from green pasta dough (it has spinach in it) to actual environmental tips, such as using cold water whenever possible, buying organic food and wine, and not using bottled water, which Batali and his partners have done at several of their restaurants. The site also includes recipes and wine suggestions, which change once a month or so, and Batali’s favorite green links, such as www.slowfoodusa.org, an “eco-gastronomic” movement designed to educate people about how their food choices affect the rest of the world.
The “Food and Wine with Mario Batali” site itself could stand to be developed a bit more, and the EarthLab creators say it will be: As is, the site is rather sparse. However, it can be exceptionally useful for the links it offers for the environmentally minded foodie. For example, Seed Savers Exchange (www.seedsavers.org) is a nonprofit that sells heirloom garden seeds to help preserve the vast variety of foods from the past, and Local Harvest (www.localharvest.org) helps people find farmers’ markets and other community-minded grocers in their area. Also be sure to check out Food & Wine magazine’s Farm to Table initiative (www.foodandwine.com/growforgood), a program designed to help people support local farms and sustainable agriculture.
www.lifethroughtime.com
Seven years ago I stood at the tide line of an estuary and began a
personal journey through time. It is humbling to imagine the immensity
of time covered by the history of life on Earth but that is what I plunged
into, with curiosity and wonder …
These are the words with which nature photographer Frans Lanting sets
the stage for his photographic story of Earth’s evolution, from the
birth of the planet’s elements more than 4 billion years ago, to
the current generation of human exploration. Each image is a look into
the past, portraying Earth and life in settings that are as realistic
as possible to that particular time.
Life: A Journey Through Time, as the project is called, can be experienced
in three ways: Visit any of Lanting’s touring photography exhibitions,
attend a show that presents the photographs choreographed with original
music from a live orchestra, or, simply visit Lanting’s life through
time Web site.
From the homepage, click on the “start the journey” icon. A
quick introduction lays out the various chapters of the photographic journey
of Earth’s history on which you are about to embark. Next, the site
directs you to a menu page where you have the option of either viewing
a timeline or the slideshow.
Click on “view the timeline” and 86 tiny icons of each photograph
appear along a scrollbar at the bottom of the page, starting at 13.7 billion
years ago. To construct the timeline, Lanting utilized various scientific
sources to determine the timing of major events on Earth, such as the
rise of particular plant and animal groups. Next, Lanting selected photographic
subjects that he thought best represented that period of time.
An eerie shot of inside the crater of Hawaii Volcanoes National Park’s
Pu’u ‘O’o volcano at dawn, for example, shows a glowing,
crusted-over lava lake and fuming cones — a scene that would have
been similar to Earth 4.4 billion years ago when its crust was solidifying,
according to the caption that accompanies the photograph. “I felt
like I had walked into a scene from the dawn of time,” Lanting writes
in the caption.
Images further along the timeline, such as jellyfish and unfolding ferns,
show complex life as it unfolds, and images of sand dunes in Australia
and ice in Greenland show extreme conditions that can challenge such life.
Specialized animals such as the cheetah make an appearance, as does Homo
sapiens, represented by the bare feet of an Ashaninka Indian who had never
left the forest of Peru.
Each image is accompanied by the option to “learn more,” which
includes the photograph’s title, location and description. Additionally,
Lanting provides a brief scientific explanation of how he thinks the image
fits into the timeline.
For a more dramatic presentation of the images, click at any time on “view
slideshow” for a seamless, ordered presentation of the photographs
accompanied by music. Each image is accompanied by a single line of text
that ties together the photographic story of Earth’s history.
More information about Frans Lanting, the life through time project, exhibits
and more, can be found at the “More about LIFE” link from the
homepage. If after visiting the site you feel inspired to head outdoors
with camera, this is also a good place to read up on some photography
tips, and to find out if Lanting is hosting a photography seminar in a
city near you.
www.nmnh.si.edu/paleo/geotime/main/
Seasoned geologists might already know which epoch came first, the Pliocene
or the Pleistocene. Still, for many, keeping straight the many points
in geologic time poses a formidable challenge. To help, the Smithsonian
National Museum of Natural History’s geologic time Web site serves
as an excellent reference, offering a visual of geologic time, that starts
with the Hadean eon 4.0 billion years ago, during which Earth’s crust
formed, and leads up to the present Phanerozoic eon.
The site’s main feature is a toolbar at the top of the page, which
lays out 20 different categories of time along a scrollable timeline.
Zoom in and out for a closer look at each eon and its subcategories of
eras, periods and epochs.
Click on Pliocene, for example, to learn that the span between 5.3 million
and 1.8 million years ago represented the age of mammals, and notably
the appearance of early bipedal human ancestors. Click on Pleistocene
to learn that between 1.8 million and 11,500 years ago, humans expanded
their location and further developed culture. Also, land at this time
was affected by striking changes in climate.
To learn more about what happened during the Pleistocene, click on a category
under the “contents” column on the left side of the homepage.
Here, you can learn, for example, that the Pleistocene was marked by 20
cycles of advancing and retreating glaciers. Or, you can also examine
locations of early human fossil finds.
The other time spans are also worth browsing, and many include pictures
of fossils dated to the time. The chart will take you right up to the
current Holocene epoch — when humans gained the technology to read
about geologic time online.
www.classzone.com/books/earth_science/terc/navigation/home.cfm
The Exploring Earth Web site was designed to accompany the high school
earth science textbook. But even if you don’t have the book or are
no longer in high school, do not let that deter you from checking out
the site’s valuable resources, including descriptions and visuals
to help anyone understand a wide array of earth science topics.
From the homepage, you can select from a toolbar how you wish to navigate
the site. Click on “investigations” to find activities that
coordinate with chapters in the book. Investigate, for example, an interactive
map of South America and Africa that shows where evidence was found that
suggests that the two continents were once joined. Or, see photos of oil
spills in the environment, before watching an animation of how oil spilled
from the Exxon Valdez, and why cleanup crews might find such information
useful. The eight units and 30 chapters cover a wide range of earth science
topics, and even delve into geology on other planets.
Perhaps the best use of the online medium, however, is the “visualizations”
section listed on the homepage’s toolbar. This section groups all
of the photos, animations and 3-D models from all of the chapters into
one place. Watch an animation that shows how tectonic stresses, weathering
and gravity combine over time to create arch formations familiar to the
U.S. Southwest. Or, watch how heat and pressure deep in Earth form metamorphic
rock.
Be sure to check out the remaining sections to find links to the data centers that conduct earth science research, as well as current information about how the data is collected. And if you want to find out about a career in the earth sciences, check out the “local resources” and “careers” links to find out what it takes to get a particular job, and to read Q&As with people already in the field.
www.thenakedscientists.com
The Naked Scientists broadcasters are not actually naked; rather, they
“strip down” science to make it understandable and exciting
for general audiences. Podcasts cover topics beyond the earth sciences
with stories such as “why people will eat stale popcorn if it’s
in a large bucket” and “jumping gives kangaroos the jitters.”
Included in that mix, however, you can also hear about “cracking
the surface of Mars” and “how volcanic gases affect the atmosphere.”
You never know what you will hear next from this group of physicians and
researchers from the University of Cambridge in the United Kingdom, during
their weekly hour-long show. Visit the homepage for links to the podcast.
Additional links from the homepage take you to science articles, radio
archives and the option to ask a scientist questions by e-mail.
www.podcast.noaa.gov
The National Oceanic and Atmospheric Administration (NOAA) began podcasting
last June, turning press releases into peppy audio stories with sound
effects and interviews. Listen to a NOAA hurricane forecaster describe
the conditions that contributed to the record-breaking 2005 hurricane
season. Or you can listen to an interview with a scientist who is stationed
aboard a research vessel north of the Galapagos Islands, studying an active
volcanic seam at the seafloor. The site gives you the option of reading
the story or listening to it, but beware that the content is not exactly
the same; listen to the podcast for ease of digestibility and look at
the story for superb NOAA graphics. One drawback, however, is that the
podcasts are not regular, so you have to frequently check the site or
your download list.
www.science.nasa.gov
Science@NASA has now made their headline stories available via podcast.
Tune in to find out why dust on the moon smells like gunpowder, or to
hear about the unusual lightning that accompanied hurricanes in 2005.
From the homepage, click on “listen to story,” or follow the
“podcast info” link to learn how to subscribe.
ww2010.atmos.uiuc.edu
In addition to reading a common atmospheric sciences textbook, teachers
and students alike should visit the Weather World 2010 (WW2010) site.
The project was put together by the atmospheric sciences department at
the University of Illinois, Urbana-Champaign, and pools together Internet-based
educational resources. Included are instructional models for teachers,
archived weather data, student projects and real-time weather data.
One of the activities in the “reading maps” section displays
an archived map of the United States with temperature gradients. Descriptive
text walks students through the process of how gradients are used to spot
storm fronts and, in the next step, students click on a real-time temperature
map where they can practice looking for existing fronts.
Next, the “online guides” tab takes visitors through lessons
in the fundamentals of meteorology, remote sensing and reading various
weather maps. Terminology throughout the reading links to definitions
and related Web sites. Animations are also sprinkled throughout, which
give a new flare to otherwise textbook-like material — in the “classroom
activities” section, you can watch how precipitation forms when a
cold front approaches warm air.
For a reminder of how physical processes can produce dramatic results,
click on the “archives” button. Here you can view case studies
of extraordinary storms, such as the 1996 tornado in Illinois and Hurricane
Andrew in 1992. If applicable, you will find radar and satellite images
along with news headlines and personal accounts.
After learning the basics, the site gives students ideas for long-term
projects. The site provides the data, and students make their own regular
forecasts and then check their accuracy under the “current weather”
tab. The innovative idea, however, is that WW2010 encourages students,
throughout the length of the project, to interact with a mentor meteorologist
at the University of Illinois via e-mail, video conferencing or a visit
to the classroom.
iwin.nws.noaa.gov
The National Weather Service collects data and issues weather forecasts,
watches and warnings that directly affect the public. But getting the
word out is not always an easy task; so, in 1994, the Interactive Weather
Information Network Service was created as an online “user friendly
interface to the weather.”
The main page features animated radar and satellite imagery of the United
States for the last six hours. Below the images are selections of buttons
that lead to local, national and world weather. Probably the most useful
is the local weather page, which features an interactive U.S. map. Click
on any state for forecasts and current hourly conditions, in addition
to watches and warnings for tornados, thunderstorms, floods and more.
States are color-coded — red for active warnings and yellow for special
information. You can also find warnings listed in the “national warnings”
button. Click on any category, from floods to hurricanes, to find out
which locations are affected.
The “national items” button on the main page links to a page
that summarizes data according to subject. The topics include national
flooding data, an ultraviolet index forecast, earthquake and tsunami data,
and temperature and precipitation tables. One caveat: The text format
of the summaries tends to be difficult to read.
Check back to this site over the next few months as the National Weather
Service begins to use newer systems, which it says will improve the delivery
of weather information online.
www.nasa.gov/hurricane
Just in time for the 2005 Atlantic hurricane season that began in June,
NASA launched its new hurricane resource page. Visitors to the site can
look up archived storms, learn about how they form and track current hurricanes
as they occur throughout the remainder of the season that concludes in
November.
When Hurricane Emily began as a tropical storm July 13, NASA’s Tropical
Rainfall Measuring Mission satellite — equipped with the first radar
in space for the purpose of measuring rainfall — collected data on
Emily’s intensity. The result was a composite overhead image of the
storm, depicted in shades of gray, as it approached the Winward Islands.
Over the period of one day, Web site visitors could watch as the tropical
storm grew into the second raging hurricane of the season. The NASA imaging
device called the Quick Scatterometer (QuickScat) recorded the storm’s
structure, which scientists used to create images depicting color-coded
wind speeds, available on the site’s main page.
QuickScat imaged Tropical Storm Emily the morning of July 13, and revealed
central high winds to peripheral low winds. By that evening, however,
images revealed that the high winds had increased within the center of
the storm. Similar pictures allowed browsers to follow Emily as it turned
into a Category-4 hurricane (out of the strongest possible Category-5
storm, based on the Saffir-Simpson intensity scale) on July 16, when it
moved away from the Cayman Islands and headed toward Mexico.
In addition to tracking hurricanes, you can also peruse the multimedia
section, which features two videos, Birth of a Hurricane and Looking at
Hurricanes. Using computer models and animation, the videos teach visitors
about hurricane formation and the technologies NASA uses to study the
violent storms.
www.leakeyfoundation.org
Supporters of anthropologist Louis Leakey established a foundation in
1968 in his name, with the goal of increasing public knowledge about human
origins and evolution. But also evolving are the Leakey Foundation’s
methods to help realize that goal, which now include an informative Web
site.
Click on “News & Events” to see a compilation of paleoanthropology
news releases from both the foundation and national news agencies. The
archived stories date back to 2001 and cover a range of topics from the
discovery of ancient human and Neanderthal fossils, to studies on the
behavior of our oldest relatives.
If adventure combined with learning from the expert scientists about human
origins sounds interesting, look under the “Travels” tab for
a list of scheduled expeditions. The only caveat is that to participate,
you must first become a fellow of the foundation, which entails a donation
of at least $1,000. This month’s trip, scheduled for Sept. 11 to
17, will be a tour of ancient rock art through Seven Miles Canyon in Arches
National Park, Utah.
Free of charge, you can click on the “audio archives” tab to
listen to anecdotes, interviews and lectures straight from the scientists
without leaving your computer.
pasadena.wr.usgs.gov/step
Between 1974 and 2003, California ranked second in the United States
for the number of total earthquakes. To help prepare for future California
seismicity, the U.S. Geological Survey (USGS) has developed a new Web
site to help predict the likelihood, within 24 hours, of a California
quake.
The page features a California state map that depicts the probability
of strong shaking at a level of intensity labeled a Modified Mercalli
Intensity VI. The Mercalli scale (I through XII) does not measure the
Richter-scale magnitude of an earthquake; rather, it qualitatively describes
a quake’s intensity based on human responses and levels of damage
across a region. The map on the USGS site is colored in gradients showing
the probability of a mid-intensity earthquake of level VI, strong enough
to throw objects from shelves. Blue colors approximate a 1 in 1 million
probability of a quake generating level VI damage, while yellow to red
colors represent about a 1 in 10 probability.
Updated hourly, the map is constructed using techniques developed by the
Swiss Seismological Service and the Advanced National Seismic System,
a U.S. earthquake monitoring network (see Geotimes,
October 2000). Of the two datasets used to create the map, the first
describes background probability — an unchanging description of probabilities
based on only fault data. The second layer changes with time and considers
probabilities based on recorded earthquake data and aftershock histories.
Together, the data form a composite image of time-sensitive earthquake
hazards.
Links from the earthquake forecast page include brief descriptions of
the map, how it was made, how to use the map and definitions of earthquake
jargon. Links from the same page to the larger USGS site are also worth
browsing. They include a map of the “latest quakes” in the United
States in addition to a regional “Did You Feel It?” map, which
enables people to click on a region, select a recorded earthquake and
submit a report of what they felt. Kids might also enjoy the link to earthquake
puzzles, games, Q&A with a geologist and science fair ideas.
Although the forecast site cannot predict with certainty the exact day
of “the big one,” it can show the areas of initial risk and
could be especially useful following a large earthquake to determine the
threat of aftershocks. But the creators specify on the site that the map’s
main purpose is to educate the public about earthquake probabilities and
clustering. Most of the time the map will look the same — the risk
of being in a car accident on any one day is much higher than the risk
of a strong earthquake shaking California.
www.ecohealth101.org
The EcoHealth 101 Web site, designed by Dr. Jonathan Patz of the University
of Wisconsin, Madison (then at the Johns Hopkins Bloomberg School of Public
Health), is intended to give students and teachers “the 411”
about environmental changes and how they affect human health. Originally
designed for middle school students and teachers, the site’s information
is good for just about anyone.
Based on a graduate course at Johns Hopkins, the site provides in-depth
analysis and complicated scientific information about topics such as how
climate change affects disease spread, and how the ozone layer changes
radiation levels.
The site breaks everything down to a level that is highly readable and
visually appealing. For example, the section entitled “Taking Our
Temperature” (about measuring climate change), begins with a discussion
about what global warming is, how it is measured and then goes on to discuss
potential changes, such as more extreme events like floods and droughts.
Once you’re in that section, you can also click on areas to learn
about what sort of health problems might be triggered by floods (like
the spread of malaria, cholera and other waterborne diseases) or droughts
(such as plague and meningitis). You can also learn about steps that scientists
are taking and steps that individuals can take that might make things
better. The hope, Patz says, is that the site will give students the “real
story.”
The site also provides teachers with detailed lesson plans, student projects
and a glossary to define terms associated with environmental and climate
change, as well as links to additional resources, including news stories
on a wide variety of environmental topics.
www.who.int/globalchange
A good source for information on the potential impacts of global climate
change on humans is the World Health Organization’s (WHO) site on
global environmental change and health. As the health branch of the United
Nations, WHO has been tracking global health and disease since 1948.
The Web site opens with a statement about the Kyoto Protocol and how we
need to act now to protect vulnerable communities from future epidemics
from extreme weather events. It then delves further into both how future
climate change could affect the spread of disease and how it will affect
humans in other ways, such as by reducing biodiversity and changing ecosystems,
for example, from arable land to deserts. Despite offering a rather technical
overview of global change and potential future consequences, the site
does have links to many other good Web sites to learn more about specific
topics.
www.jhu.edu/~neareast/egypttoday.html
For the fifth straight year, Johns Hopkins University researchers spent
much of January and February in Egypt, uncovering clues to ancient Egyptian
life at several different sites. They have provided pictures and explanations
of their work online at the Egypt Today Web site, so that those of us
who could not join them could see just what they were doing. Some of the
work being followed this year includes excavations at Thebes, where the
researchers hope to study residential life in the New Kingdom, and at
tombs in Luxor, where they hope to learn about the supernatural powers
that Egyptians believed their dead to hold. The site also has information
from past expeditions, for example, when researchers excavated the Mut
Temple and burial sites in the Valley of the Kings. The Egypt Today site
also has maps of Egypt that show excavation sites, along with interesting
historical, archaeological and geological information.
volcano.und.nodak.edu/vw.html
Volcano World, a Web site run by the University of North Dakota, provides
links to an amazingly long list of the world’s volcanoes. Search
by country, region or volcano name to quickly find a listing of volcanoes.
Once you click on a volcano’s name, a picture of it pops up (most
are satellite images) along with a brief description of where it is and
what surrounds it. For example, choosing Australia for a regional search
yields a couple of beautiful pictures of Egmont Volcano in New Zealand
and Yasur Volcano on Vanuatu. Then, there are links to more images and
Web sites to learn more about each volcano. The site also has a section
devoted to current eruptions, as well as teaching aides (such as lesson
plans and activities) and a whole section devoted to kids, which includes
games and school project ideas.
soil.gsfc.nasa.gov/forengeo/secret.htm
Take a closer look at how soils can help solve a criminal case on the
Secrets Hidden in Soil Web site. Sponsored by NASA and the Soil Science
Society of America, this Web site begins with a quick overview of soil
science, such as how soils form from parent rock and how climate and topography
among other things help differentiate one soil from another. The site
then walks you through the techniques used by forensic geologists to solve
crimes, from gathering the soil evidence and what to look for, to particle
and color analysis. After learning about how various microscopes and other
technologies help the forensic geologist analyze soils, the site offers
several examples of how forensic geology was used in real-life cases to
solve crimes. Much of the information on this page was borrowed from Ray
Murray's 1975 textbook Forensic Geology.
In addition to seeing how soils help solve crimes, the site links to its parent, the Soil Science Education Web Site, which has a plethora of information on soils — everything from introducing soil science basics to human impacts on soil and how it affects agriculture.
www.fbi.gov/hq/lab/org/labchart.htm
For any students thinking about getting into a forensic science career,
check out the FBI laboratory's Web site first. It will give you a good
overview of what the job really is — as opposed to what you might
see on TV — and what types of things you might be doing, whether
it be most related to geology, biology or chemistry. Broken down by unit,
such as trace evidence (fibers, hairs), DNA, computer analysis, questionable
documents or materials analysis (under which soils and metals fall), this
site explores the various paths a student can take to becoming a specialist.
Under materials, for example, you can learn about metallurgy, mineralogy and elemental analysis, such as looking for heavy metals in a strand of human hair. In the chemistry section, you'll find paint pigment and building materials analysis, which are topics also frequently covered by the forensic geologist. This informative site also links to the FBI's Handbook of Forensic Services, which is used by forensic scientists and crime scene investigators around the country.
www.volcano.si.edu
Since the 1960s, the Smithsonian Institution has been running an informative
service called the Global Volcanism Program. The program and its Web site
are designed to provide information about active Holocene volcanoes, from
10,000 years ago to the present. The site is divided into two main components:
volcano history and current volcanic activity.
Click on “volcanoes of the world” to search by name, region or eruption date. If you search by region, you get a bright map lit up with little red triangles that indicate volcanic activity during the Holocene. (It vividly reveals the Pacific Ring of Fire.) If, for example, you wanted to learn about volcanoes in Indonesia, you click on the country to get a close-up view. Clicking on an individual red triangle provides information about that volcano’s history, including its last known eruption and the damage it caused.
The other component of the program’s site is volcanic activity reports. The monthly bulletin details monthly activity of active volcanoes, while the weekly activity reports, a cooperative project between the Smithsonian and the U.S. Geological Survey, detail current eruptive activity around the world.
www.earthquakecountry.info
Amid the multitude of urban legends out there about California and earthquakes
in general — including that the state might suddenly break off and
fall into the sea or that Earth could open up and swallow you whole —
you might be confused about some of the facts. This site is a good place
to learn the basics. The Earthquake Country Web site, operated by the
Earthquake Country Alliance and the Southern California Earthquake Center,
is broken up into four convenient categories: what you should know, why
you should care, what you should do before a temblor, and what you should
do during and after one. The first two categories are the most relevant
to people living outside of earthquake country, and the second two are
most relevant to anyone who wants to be prepared, whether living in Southern
California or anywhere else.
The most fun part of the Web site, arguably, is the section on separating
fact from fiction. It’s not easy to find this section of the site,
located at (www.earthquakecountry.info/10.5),
but it’s worth the extra typing to find it. Inspired by the recent
NBC television miniseries 10.5, this section debunks common myths, especially
those propagated by movies and television series. And no, the geologists
assure, earthquakes cannot be caused by wet weather, and lubricating faults
isn’t going to help prevent a quake.
www.biogeosciences.org
The first thing a visitor wandering onto the Biogeosciences Web site might
wonder is what exactly “biogeosciences” means. Luckily, this
new site from the Geological Society of America tells you right away:
It is the study of the interactions between life and the Earth’s
atmosphere, hydrosphere and geosphere — the merging of the biological,
chemical and physical sciences. This Web site brings the emerging field
to a broader public through its explanations of the history of the field,
descriptions of scientists doing the work and simple definitions of projects.
The site also brings together scientists who may be working on biogeoscience
projects through its resources section (which offers links to funding
opportunities as well as jobs in the field) and its discussion forum.
Similarly, biogeoscientists or those in training might benefit from the
events calendar. Finally, this well-designed Web site offers quite a few
external links to sites for more information on any aspect of biogeoscience
— good for kids, parents and teachers, as well as biogeoscientists.
wine-regions-of-the-world.co.uk
While traditional winemakers of France, Italy and Spain still lead the
world in total wine production, many other nations are not far behind,
including the United States, Argentina, Australia and South Africa. Today,
wine production is truly a global affair, as you’ll see on the Wine
Regions of the World Web site. Featured on the site is a global map with
highlighted wine-specialty areas. Click on a location and you are carted
off to learn about the types of wine grown in that particular area and
what climate and soil make the region conducive to growing grapes. New
Zealand, for example, hosts nearly 400 individual wineries and is most
famous for its Sauvignon Blanc varieties of wine, although the country’s
diverse soils and climate allow nearly every variety of grape to grow.
In addition to learning about regions, you can also learn about the science
behind growing grapes, such as how microclimates affect different grapes
and how grapevine roots can reach up to 10 feet below ground to reach
water, negating the need for irrigation.
Although this Web site may not make you a connoisseur
of wines, it will give you some idea of what to look for next time you
step into the wine shop, and it will give you some fascinating tidbits
to share with colleagues and friends over a glass of Chardonnay at the
next geology conference or happy hour.
homepage.smc.edu/robinson_richard/geologycentral.htm
Geologist Richard Robinson at Santa Monica College in California has created
the “Geology Central” Web site, which is essentially a giant
list of links to other cool geology sites. Divided into three categories
— virtual geology fieldtrips, geology links and animated sites —
the site offers something for everyone. The field trips section includes
hundreds of links to Web sites of places to visit, either virtually or
in person, such as the beaches in Monterey Bay, Calif., or fossils in
Agate Fossil Beds National Monument in Nebraska. This Web site can be
a great resource for teachers and a good site for students learning about
the geology of different parts of the world.
www.lpl.arizona.edu/impacteffects
If you have ever wondered what would happen if an extraterrestrial projectile
— meteor, asteroid or comet — were to hit Earth, the University
of Arizona has a Web site for you. Designed by impact specialists at the
Lunar and Planetary Laboratory, this site allows you to enter any number
of factors, including the size, velocity and density of the projectile,
as well as the type of surface it is hitting (ocean, soil or rock), to
determine the environmental consequences of an impact striking anywhere
on the planet. Watching the various scenarios unfold around the world,
such as global fireballs and seismic shaking, is a fun, if morbid, experience.
www.uc.edu/geology/geologylist/
A University of Cincinnati geology master’s student created the Geologist’s
Lifetime Field List Web site in 1996, based largely on a Geotimes column
in 1990 by Lisa Rossbacher. This site expands upon that column, providing
a full list of geologically significant places and events to experience.
The site is subdivided into four main categories: generic geology sites,
such as an erupting volcano and the K/T boundary (and lists places to
view said volcano or boundary); specific locations, including Terra del
Fuego in South America, Michigan’s banded iron formations and the
Great Rift Valley in Africa; things that need to be experienced rather
than seen, such as feeling an earthquake that’s greater than magnitude
5.0 and finding in situ dinosaur tracks (try the backcountry of southern
Utah); and finally, “the best of the rest,” which includes witnessing
a tornado (and rules for storm-chasing) and viewing the Aurora Borealis.
The site has pictures and links to almost every place
it suggests you visit. Be aware, however, that some of the links are broken.
So, you may have to do a little additional work yourself, but learning
about these places will be well worth it.
whc.unesco.org/heritage.htm
While not as flashy as the Lifetime Field List Web site, the United Nations
Educational, Scientific and Cultural Organization’s (UNESCO) Web
site is a comprehensive list of all of the World Heritage sites in the
world. If you’ve ever wondered what places are World Heritage sites,
how they were chosen and where to find them, this Web site will answer
your questions and provide you with an extraordinary tour of some of the
world’s most magnificent places. Covering more than 700 sites, the
list is divided by country and date of designation.
Clicking on one of the sites (for example, Mesa Verde in the United States)
will give you a brief description of the site (a concentration of Pueblo
Indian dwellings deep inside cliffs in the Southwestern United States)
and why and when it became a heritage site. It also includes pictures
of the sites; and in the case of some of the more well-known locations,
such as Mesa Verde, Stonehenge, the Acropolis in Athens and the Galapagos
Islands, you can link to other Web sites about the locales.
http://3dparks.wr.usgs.gov
For a new view of some of the West’s most impressive scenery, check
out the Geology of National Parks 3-D Web site. The site features 3-D
and 2-D images of scenes in 14 different national parks, with plans to
add four new parks in the next few months and hopefully more after that,
says site creator Phil Stoffer.
Stoffer and his partner, Eleyne Phillips, are both geologists at the U.S.
Geological Survey’s (USGS) Western Earth Surface Processes Team in
Menlo Park, Calif. Stoffer developed the Web site out of a personal interest
in stereophotography that hearkens back to his great-grandmother. He and
Phillips take all of the pictures themselves, make them into 3-D images
and write all of the captions.
For optimal viewing, you should first locate your old comic-book 3-D glasses
or purchase a pair. Although every image on the Web site is available
as a standard digital image as well as in 3-D, you’ll certainly get
more out of them in 3-D. Red and cyan 3-D viewing glasses will work best
for these anaglyphs.
When you enter the site, you encounter a list of the parks available.
Put on your glasses and click on a park. (I recommend doing this in a
private place, or like me, you’ll have colleagues walking by and
giggling.)
The first image that pops up for each park is a map. Some are detailed
geologic maps and some are National Park Service maps. When you’ve
figured out where you are and what you’ll be seeing, click on Next
Image. You’re suddenly whisked away to a beautiful landscape (although
some pictures are large and may take a little while to load). Accompanying
each image is a detailed explanation of the landscape features that you’re
seeing and the geologic processes that formed each feature. For example,
in Arches National Park, you can learn about exfoliation, “the process
of the peeling off of bedrock slabs or shells in a series of concentric
layers,” (from the discussion of Landscape Arch). And in the Golden
Gate National Recreation Area, you can learn about the ribbon chert layers
that were deposited in the Marin Headlands during the Jurassic.
Whichever park you visit, images abound — 20 or so per park. The
site, funded by the USGS National Park Service Cooperative Project, is
quite user-friendly, with a link back to the main page at the bottom of
every image and links to the National Park Service’s Web site, should
you want more than just geologic information about the parks. Use the
site as a learning tool or as an excellent escape from your usual workday.
And stay tuned… Stoffer and Phillips next plan to add all the 3-D
photographs collected during the Powell Survey of 1871 to 1872 of the
Canyonlands and Grand Canyon country.
www.intuitor.com/moviephysics
In the day and age of multi-million-dollar blockbuster movies that have
more and more implausible action scenes, one Web site is taking a stand.
The Insultingly Stupid Movie Physics site, run by an engineer and some
self-proclaimed computer nerds, has reviewed quite a few movies for their
scientific accuracy — or complete lack thereof. The rating system
is simple: GP means good physics in general, PGP means pretty good physics
(enough to be fun, the site owners say), PGP-13 means kids under 13 might
believe the physics, RP means "retch," XP means obviously subject
to physics laws of another universe, and NR means it wasn't even rated.
Take The Core, for example, which Geotimes also reviewed and found to have scientific inaccuracies (Geotimes, October 2003). This Web site says the poor physics provide nonstop surprises, and it is rated the worst physics movie they've reviewed. The site also reviews Armageddon, an asteroid-impact movie from 1998, starring Bruce Willis and Ben Affleck, where a group of misfits from an oil-rig have to save Earth from the impending doom of an asteroid impact. As the reviewers say, even if you disregard everything else scientifically wrong with the story and the crew manages to blow up the asteroid before it hits Earth, the gravitational pull from the asteroid pieces flying by Earth would disrupt the tides so much as to destroy most of life by way of tidal surge.
And as a final blow to many blockbuster hits, the site
debunks generic bad movie physics, from flashing bullets to exploding
windows and falling objects. So next time you're watching a movie and
wondering "can that actually happen?" — you know one place
to go for answers.
www.ScienceEverywhere.org
“Science. It’s everywhere” — that’s the message
of the Partnership for Science Literacy, a new public awareness campaign
launched by the American Association for the Advancement of Science. The
goal is to increase awareness among families of the importance of science
education for all children. The Web site, run by TryScience.org, provides
information for parents and teachers, including fieldtrip suggestions
across the country and around the world, and a plethora of home science
experiments ranging from turbidity experiments to DNA tests. It also suggests
science activities for families, listing organizations that sponsor activities.
The site allows parents to click through to other Web sites to help answer
questions about science education. And teachers will find the “Teacher
Tips” and links to additional resources helpful as well.
www.geomac.gov
The U.S. Geological Survey hosts a Web site that provides access to current
fire locations and perimeters across the country, something that became
vital for millions of people during the recent fires in California. The
Geospatial Multi-Agency Coordination Group, or GeoMAC, site was created
during the 2000 fire season to provide fire managers with real-time geospatial
information on the status, location and proximity of wildfires to property
and infrastructure to help them better focus resources. Updated daily,
the site first shows a map of all the fires in the United States at that
particular time. Clicking on an individual fire provides more details.
The site also keeps a running log of all fires in the country in the past
year.
observe.arc.nasa.gov
NASA’s Observatorium is an engaging Web site for earth and space
data. Not only does the site include pictures of Earth, planets and stars
and the stories behind those images, but it also includes information
on remote-sensing aircraft, how remote sensing is used in astronomy and
information on space flight. One section illustrates NASA’s efforts
to understand how Earth is changing and how humans influence and are influenced
by these changes. The site also details NASA’s planetary and deep
space exploration programs, including origins-of-life exploration, and
hosts an image gallery of Landsat images from around the world.
Teachers will love the educator resources section that provides fact sheets,
activities and other resources for use in the classroom or at home. And
scientists of all ages will enjoy the coolest part of the site —
the “fun and games” section, filled with crossword puzzles,
space trivia, a martian version of the old video game “Lunar Landing,”
a geography quiz where viewers identify world cities from just the images
of their lights at night, and a “Where in the World” quiz where
you identify cities from only their satellite views. I challenge all you
connoisseurs of world travel and satellite imagery to identify these cities
without clues — I certainly needed help!
manufacturing.stanford.edu
If you’ve ever wondered how things were made, this is the Web site
for you. The Alliance for Innovative Manufacturing at Stanford University
recently developed the site to give the general public an introductory
look at manufacturing. It explores the making of more than 40 everyday
products, from jelly beans and plastic soda bottles to denim clothing,
golf clubs and airplanes. When you click on “Materials,” for
example, you are first asked a question about the manufacture of a product:
I was asked how molten glass is formed into sheets of glass for windows.
After I typed in my response, I read what others had written, and then
a congenial narrator walked me through the true process of making glass
— from the mining of sand, gypsum and dolomite, to its melting, molding
and cutting. And if you want to learn more about the manufacturing process,
the site also has an extensive section that details processes, such as
casting, forming, molding and assembly.
www.climatescience.gov
In December, more than 1,200 scientists, industry representatives and
lobbyists met in Washington at a workshop sponsored by the Bush administration
to get feedback on a 177-page draft statement about U.S. climate change
research. At the U.S. Climate Change Science Web site, you can read this
strategic plan along with public commentary and related developments in
climate change policy.
Thirteen federal agencies sponsor the Climate Change Science Program,
which integrates federal research on climate change. Last month, the president
identified the climate change program as one of the key crosscutting initiatives
in the proposed fiscal year 2004 budget. The site provides a good overview
of the budget, recent structural changes in the program and text on where
the administration sees the future of climate change research, through
Hill testimony and supporting documents.
www.science.gov
Ten major U.S. science agencies have collaborated to launch the FirstGov
for Science Web site, a one-stop shop for government scientific information.
The free site provides alphabetical listings of more than a thousand resources
under specific topic headings, such as “Geology and Landforms.”
A search under that topic could bring you to NASA’s archive of earth
photographs or the Hawaiian Volcano Observatory. The site is easy to use
and saves lots of time in looking for specific federal programs.
www.uky.edu/KGS/pubs/lop.htm
In July, the Kentucky Geological Survey (KGS) launched the country’s
first free, Web database of a state’s oil and gas records. The site
contains information on more than 150,000 oil and gas wells drilled in
Kentucky, including scanned-in images of geophysical logs. The logs are
long documents, up to 100 feet in length, that record rock properties
and show findings at various well depths.
Previously, if you needed well information, you had to contact KGS or
travel to its local offices in Lexington or Henderson. Now the data are
electronically accessible. KGS hopes this online accessibility will help
industry increase production of oil and gas in Kentucky — exploring
both new sources and older fields that might offer new prospects. Electronically
archiving these records from the Commonwealth of Kentucky’s extensive
paper archive took more than 20 years and about $10,000 in new equipment.
The site is fairly user friendly. With a simple download of specific image-viewing
software, you can view scanned records from oil and gas wells in a specific
quadrangle of Kentucky — geophysical logs, permitting documents and
helpful information about how to navigate through the records themselves.
The site also provides a useful map for more precisely locating the wells
within Kentucky counties.
epod.usra.edu
The Earth Science Picture of the Day (EPOD) Web site collects and archives
images that highlight Earth’s diverse processes and phenomena. Every
day, the site features a new photograph, graphic or piece of artwork of
the latest earth science events, along with a short description. Supported
by the NASA Goddard Space Flight Center and the Universities Space Research
Association, the site offers interesting and fun visual diversions for
your day.
www.wku.edu/~smithch/biogeog
Biogeography explores the relationship between geography and the ecological
distribution of life — “what lives where, and why,” says
Charles H. Smith, science librarian for Western Kentucky University’s
Helm-Cravens Library. To advance the study of this field’s evolution,
Smith has opened a free Web site that contains a bibliography of works
on biogeography that were published before 1950. The online bibliography
has source links color-coded according to their availability. Links in
blue take the reader to an online copy of the article. Green links show
you source available through the JSTOR electronic journal archive. And
some links take you to biographies of the authors. Any student or teach
of biogeography will find this site a comprehensive resource for studying
the history of this field.
Earthobservatory.nasa.gov/naturalhazards
NASA’s Earth Observatory Natural Hazards Web site features satellite
images in near real time to capture natural hazards around the world.
The Earth Observatory team tracks five categories of natural hazards:
wildfires, severe storms, volcanic eruptions, floods and major air pollution
events. A different icon represents each natural hazard on a global map
that organizes the natural hazards by location. Just click on the icons
to view the most current images. The site is easy to use and provides
visitors with remarkably crisp visualizations of natural hazards around
the world.
www.google.com
A favorite among Geotimes staff members. Try this site the
next time you need to search the Web for a science-related information.
Weve found that it brings up myriad sites from reliable sources.
Give it a whirl.
mars.google.com
“Moon, Mars and beyond” is now more than just President Bush’s
vision for space exploration; Google also made the jump from the moon
to Mars on March 13, when the company launched its latest interactive
image Web site.
The company began with Google Earth, which combines satellite images with
other data into extensive 3-D presentations. Browsers can navigate Earth
and view the details of everything from the Grand Canyon and hurricane
damage to a local restaurant (see Geotimes, December 2005). Next, Google
created interactive maps of the moon that allowed browsers to explore
a lunar landing site or to peek inside an ancient crater. Visit Google’s
latest addition, however, for a close look at Mars.
The Google Mars homepage starts out with a colorful image of the planet’s
surface elevations that looks anything but red. Elevation differences
range from 9 kilometers below the planet’s average surface level
(depicted by black) to 21 kilometers above average (depicted by white),
but every crater and trench that falls between those elevations spans
the rainbow.
Use the navigational tool in the upper left corner to scroll around a
seamless melding of 17,000 individual photos obtained by NASA’s Mars
Odyssey spacecraft, which has been orbiting the planet for about five
years. Also, use that same tool to zoom in on details of features down
to 230 meters across, about the size of 2.5 football fields.
If you want help finding the most interesting surface features, look to
the top of the page for lists of mountains, canyons, dunes, plains, ridges
and craters. Click on any of the 118 alphabetized mountains, such as Olympus
Mons, which the elevation scale depicts as mostly white, as this volcano,
the tallest known in the solar system, stands about 27 kilometers high
— about three times the height of Earth’s tallest mountain,
Mount Everest.
After you choose a feature to explore, markers appear on the image with
text boxes that provide information about the size and history of the
object. Links lead to an Arizona State University Web site that describes
the object’s geology in greater detail, and provides additional imagery
and statistical information.
And if you have ever wondered what it would be like to fly through a canyon
on Mars that is as deep as Mount Everest is high, download “Flight
Into Mariner Valley” from Google video at: video.google.com/videoplay?docid=-1622667251598627943.
About 10 times as long, five times as deep and 20 times as wide as Earth’s
Grand Canyon, it is difficult not to feel small (or sick) while maneuvering
around the winding branches of Mariner Valley.
A team at Arizona State University compiled more than 500 images of the
canyon obtained from NASA’s orbiting Mars Odyssey spacecraft. NASA’s
Jet Propulsion Laboratory’s Digital Image Animation Laboratory then
used those images to create this detailed virtual airplane tour.
As a bonus, the movie’s narration describes how different features
within the canyon might have formed. For example, while cruising alongside
a valley wall, you learn that such cliffs likely began to form billions
of years ago as a result of earthquake faulting. Another side of the canyon
possibly formed as groundwater led the ground surface to collapse in on
itself. Keep in mind, however, that planetary geologists are still finding
out details about Mars’ land and water processes, and current ideas
could one day be revised.
websitegarage.netscape.com
Trying to get your Web site up and running all on your own? Not sure if
all of your links are working or if pages are loading too slowly? This
Web site garage can help you pinpoint the areas that you need to work
on to make your site as user-friendly as possible. To use the site, simply
type in the URL of your Web site and the e-mail address you want your
results sent to. In addition to pointing out the specific reasons why
you should fix problem areas, the site is a how-to guide for making repairs.
It can also run a monthly check on your site.
www.findsounds.com
When it comes time to present your work to your peers you have some options
available. Theres the old overhead and emergency index cards presentation,
but some geologists now feel comfortable using various slide-show programs
on their laptops that take advantage of hi-tech lecture halls. Regardless
of the favored method of presentation, theres always one funny guy who
throws in a goofy picture of someone at field camp, doing something only
a wild and crazy geologist would do, and summons a few laughs out of the
drowsy crowd. Go one step further: Wow them with your technological know-how
and your stunning wit. Visit FindSounds.com and download a few sounds
to accompany your presentation. Its free and you can choose from rain,
earthquakes, volcanoes, waterfalls, avalanches or the usual animal and
miscellaneous noises. Youll surely get aor at least a few of your colleagues
will wake up to catch the end of your presentation.
www.scienceprof.com
ScienceProf.com is a collection of Windows, Macintosh and Web resources
for professors specializing in geosciences and physical sciences. The
high quality images and information are for the college level. Many of
the programs are run as interactive Web presentations ready-to-use on
a teachers Web page. Links to the movies and other information can be
included in a Web page with additional explanatory notes or used on a
local computer.
The Web site includes access to photo collections and slide sets, as well
as teaching products for earth and planetary science to sedimentology
to strain analysis to physics. The site offers products for teaching growth
faulting, the process of crystallization in igneous rock, magnetic reversals,
and much more. Users can download demos of the products but subscriptionsfor
individual professors up to an unlimited number of studentsare required
for professional use.
www.chemfinder.com
Looking for that tricky chemical formula that you always seem to forget?
Need to know the density of a particular substance? Try ChemFinder. Not
only will you find the answers to the questions above, youll also find
information such as the boiling and melting point and solubility of various
chemicals. Link to other information about the environmental and health
hazards of the chemical or view the chemical structure in 3-D.
personal.cmich.edu/~franc1m/homepage.htm
Bookmark this site: Resources for Earth Science and Geography Instruction.
It contains googles of links to credible earth science Web sites in myriad
disciplines. Whats more, the site is updated several times a month by
Mark Francek, a professor of geology at the University of Michigan. Its
volumes of helpful links are organized by subject matter. It has no images,
just quick-loading, easy-to-read text. Not much else needs to be said
other than take a look and see for yourself.
www.athro.com/geo/hgframe.html
Unless you carry a geological time scale in your wallet (the trademark
of my universitys paleontology students), youll have to rely on memory
to pass this sites Geological Time Line Quiz. Fill in the eons, eras
and periods that span Earths history, hit Submit and prepare for responses
like, The Neogene was not found. After this humbling experience check
out the sites Metaphors for Geologic Time to fill in your Earth history
knowledge gaps.
www.windows.ucar.edu
It's summertime — time to explore and leave your work behind, at
least for a few days of vacation … but, if you can't, try a fun Web
site, like Windows to the Universe, run by the University Corporation
for Atmospheric Research in Boulder. Offering a rich array of images,
animations, datasets and documents, the site looks at the cultural ties
between science exploration and history. It provides a wealth of information
on earth and space sciences — including information on every planet
in the solar system and what we know beyond. The "Amazing Water Facts"
page is a great page for reference, in case you cannot remember the longest
freshwater lake or the muddiest river in the world. Be sure to check out
the mythology section, where you can read up on lore from ancient societies,
including the Greek, Mamaiuran (an Amazon Indian tribe that lives in Brazil)
and Norse, to name a few.
This engaging site is mostly aimed toward kids, with beginning, intermediate
and advanced levels each corresponding to elementary, middle school and
high school reading levels, respectively. (I found that the major difference
among the levels was simply in text size on the screen.) But the site
has something for everyone — students, teachers and those looking
for some summertime Web fun.
www.fi.edu/earth
After touring the universe, you can narrow-in on Earth and the forces
that shape it, by visiting the Franklin Institute's Earthforce Web site.
Part of a larger site for the Philadelphia museum, the site offers great
information on how Earth forces are manifest in the water, the crust and
deep within the planet. Most notably, it features tons of great Web links
to learn more about earthquakes, avalanches, tsunamis — the list
goes on. Also, stop by the Franklin Institute home site (www.fi.edu)
to learn more about the museum and other areas of interest.
www.nps.gov/parkoftheweek
Don’t have time to drive from Cape Cod National Seashore to Yosemite?
Denali National Park to Everglades? Thanks to a new National Park Service
Web site, you can virtually visit a different national park each week.
The Park of the Week site provides you a picturesque glimpse into the
park’s history, attractions and ongoing projects. And if by chance
you are planning a trip to that park, the Web site offers information
highlighting current events and activities at the park, as well as any
construction projects or need-to-know information. Once you’ve explored
the Park of the Week, with just one click, visit any other national park
through the Park Service’s main Web site. Updated each Monday, the
Park of the Week can also be accessed via www.whitehouse.gov
and www.doi.gov.
Education
ngwa.org/museum/museum.cfm
Alexander the Great might have been the first person to trace the path
of groundwater, using horse carcasses to accomplish the feat, according
to the National Ground Water Research and Educational Foundation. And
Aristotle perhaps dabbled in discussions about the mechanics of aquifer
systems.
Historical factoids about notable groundwater scientists throughout history
are just one topic worth exploring at the Virtual Museum of Ground Water
History Web site. From the homepage, you can easily navigate all seven
wings of this truly virtual museum that exists only in cyberspace, although
some items can be found on display at the National Ground Water Association’s
headquarters in Westerville, Ohio.
To navigate the site, simply click on the “Select Wing” menu
and choose from a variety of exhibits. “Drilling devices of yesteryear,”
for example, will take you on a tour of black-and-white photographs of
drilling rigs that date back to the late 1800s.
If you enjoy perusing maps, check out the collection of state aquifer
maps. Each state is color coded by sediment type, and most provide cross-sectional
views of various layers and major aquifers. One problem, however, is that
without a date on the map, visitors can’t determine how groundwater
levels have changed over time.
evonet.sdsc.edu
The EvoNet Web site, run by the University of Oregon, was set up to provide
the educational community with resources to aid in teaching evolution
at all levels. The site is divided into three primary sections: research,
public outreach and education. There is an additional search engine for
finding scientists doing evolutionary research. The home page also is
divided by areas of interest, such as geology and anthropology, with each
of the interest areas linking to educational curricula, software and researchers.
The research section of the site provides listings of people, institutions
and links to other Web sites to connect the scientific community. The
public outreach section contains outside sources for information about
presenting evolutionary concepts to the public, and how to combat creationist
tactics.
The education pages on the site link to various lesson plans through the
National Health Museum’s Web site, which provides curricula on a
plethora of topics for bioscience and health teachers. Through EvoNet,
there are lesson plans on everything from figuring out how fast dinosaurs
walked (or ran) to understanding radioactive decay. There are also lab
exercises, such as a hominid skull comparison, and a couple of field trip
suggestions. Despite a few broken links, this comprehensive site would
be a good source for teachers, or for researchers needing to locate others
in their field.
www.awesomelibrary.org/Classroom/Science/Earth_Sciences/Earth_Sciences.html
The geoscience pages of the Awesome Library Web site are terrific for
teachers looking for lesson plans on topics ranging from weather on Mars
to dinosaur fossils. Part of a larger site that includes 26,000 resources,
the pages link to other Web sites where teachers can find out more about
a topic to help guide them through lesson planning. The site has a seemingly
endless supply of resources for teachers, though its organization is a
little bit confusing (for example, a link to a site about caves is listed
under “materials”). Still, the site could be a great resource
for earth science teachers anywhere, especially with the option to translate
each page into one of 14 different languages, from Italian to Malay.
www.discoverourearth.org
The Discover Our Earth Web site, run by Cornell University’s geology
department and sponsored by the National Science Foundation, offers a
wealth of earth science information for students and teachers. The site
is an interactive classroom-based teaching tool about earth science systems,
with online mapping and modeling projects for the students — such
as mapping the world’s earthquake zones and then seeing where various
magnitude quakes have occurred. The site is probably best suited for high
school classrooms. While students may not get much out of this site on
their own, it could provide a good learning experience with the guidance
of a teacher.
In the section for teachers, educators receive the same
information as the students so they can walk them through the program,
plus additional background information, curriculum guides and suggested
questions and answers. The material covers five earth science topics,
including topography, earthquakes, volcanoes, plate tectonics and sea-level
change. The content is solid, but be aware that the site runs relatively
slowly.
evolution.berkeley.edu
As battles over the teaching of evolution in schools ensue in districts
across the United States, the University of California at Berkeley has
released a new Web site called Understanding Evolution. Designed to provide
teachers with the fundamentals for teaching evolution, the comprehensive
and easy-to-navigate site includes dozens of lesson plans and activities
for varying concepts in evolution.
The site begins with the fundamental tenets of evolution — variation,
inheritance, selection and time — and continues on to more detailed
topics, such as specific adaptation, classification and evidence for evolution.
The site also breaks up lesson plans by grades, and includes a searchable
database of lesson plans and activities should you want an activity for
a single concept and a single age group. Finally, should you want a few
more resources at your fingertips, you’ll find a list of further
readings and Web resources.
museum.gov.ns.ca/fgm
Canada’s Bay of Fundy, known as home of the world’s highest
tides, is also home to the Fundy Geological Museum. Their Web site is
frequently updated, easy to navigate and highlights dinosaur excavation
projects, as well as current exhibits at the museum.
www.cnie.org/nle
Looking for credible Web sites to suggest to students beginning research
on an environmental topic? The National Council for Science and the Environments
National Library for the Environment Web site links to myriad environmental
resources including news sources, a yellow pages directory of environmental
contacts and Congressional Research Service Reports. Click on Researchers
Bookmarks to view links to information on international environmental
treaties, state and federal agencies, environmental laws, online library
catalogs, and search engines.
www.pbs.org/wnet/savageearth/animations/index.html
Teaching an intro geology course in the fall? Want your kids to understand
what your talking about when you point out a normal fault in a road cut
on your next family vacation? Direct them to this page on the PBS Web
site. It has great animations of difficult-to-explain geologic phenomena
such as dip-slip faulting, plate subduction, secondary and primary wave
propagation and several longer animations with detailed explanations of
the geologic processes. The animations are part of PBS ((Savage Earth))
section of its Web site, which offers basic information on many different
geologic processes.
www.cmich.edu/~Franc1m/homepage.htm
Resources for Earth Science and Geography Education is an education tool.
It is continually updated with links to carefully screened sites selected
based on image quality, ease with which lesson plans can be developed,
organization, authenticity, scope and format. The site covers such topics
as maps, GIS data sets, coastal landforms, geologic time, climate and
planetary geology. Mark Francek of Central Michigan University maintains
the site and also sends out a weekly e-mail alert that features an earth
science site of the week. E-mail Mark.Francek@cmich.edu to be added to
the listserve.
www.scienceprof.com
ScienceProf.com is a collection of Windows, Macintosh and Web resources
for professors specializing in geosciences and physical sciences. The
high quality images and information are for the college level. Many of
the programs are run as interactive Web presentations ready-to-use on
a teachers Web page. Links to the movies and other information can be
included in a Web page with additional explanatory notes or used on a
local computer.
The Web site includes access to photo collections and slide sets, as well
as teaching products for earth and planetary science to sedimentology
to strain analysis to physics. The site offers products for teaching growth
faulting, the process of crystallization in igneous rock, magnetic reversals,
and much more. Users can download demos of the products but subscriptionsfor
individual professors up to an unlimited number of studentsare required
for professional use.
www.enc.org
The Eisenhower National Clearinghouse Web site was designed as an archive
of learning and teaching materials for K-12 teachers and students in the
fields of mathematics and science. However, it is also a useful tool for
teachers, students and professionals who are working on a project or assignment
that requires them to dig back into the dustiest corners of their brain
to find some obscure formula or theorem they learned back in high school.
Users can find information based on topic or based on intended audience.
Much of the information is accessed through links to outside sites that
the ENC editors have reviewed and deem credible and appropriate for a
K-12 audience.
www.athro.com/geo/hgframe.html
Unless you carry a geological time scale in your wallet (the trademark
of my universitys paleontology students), youll have to rely on memory
to pass this sites Geological Time Line Quiz. Fill in the eons, eras
and periods that span Earths history, hit Submit and prepare for responses
like, The Neogene was not found. After this humbling experience check
out the sites Metaphors for Geologic Time to fill in your Earth history
knowledge gaps.
Back to index
feeds.feedburner.com/BytesizeScience
In 1951, Don Herbert — better known as “Mr. Wizard” — started his own television show in order to get kids hooked on science. Saturday mornings found Mr. Wizard building a mini volcano, a sauerkraut battery and a host of other simple devices to demonstrate complex concepts. But times have changed and so has the technology. The American Chemical Society (ACS) is hoping podcasts can do for today’s kids what “Watch Mr. Wizard” did for baby boomers.
In November, the Washington, D.C.-based society launched “Bytesize Science,” a weekly chemistry podcast aimed at children and teens. The three-minute episodes, available for download at feeds.feedburner.com/BytesizeScience or on iTunes, cover new research on everything from how water striders walk on water to how bacteria communicate. The stories come from ACS’s 36 peer-reviewed journals. “We try to choose stuff that kids can identify with that happens to have even a tangential relationship to science,” says Adam Dylewski, the show’s host. Hot topics include bad breath and belly flops.
Turning the technical jargon in journal articles into something kids — or even adults — can understand can be a challenge. “We never try to dumb it down,” Dylewski says. “But we may omit certain portions of an experiment that won’t hold the interest of kids.” Adding sound effects helps too. “Bytesize Science” is sprinkled with gurgles, screams, kissy noises and an occasional groan. Chemistry is “a lot easier to swallow when it’s wrapped in toilet sounds,” Dylewski says.
Only a hundred people have subscribed so far, but the show is slowly gathering steam. A few schools and libraries already recommend the podcast. “ACS is really interested in reaching young people of all ages, especially those who are thinking about what to do with their future,” Dylewski says. Kids who get hooked on science at a young age are more likely to pursue subjects like chemistry in high school and college. And more budding chemists translate into more members for ACS.
The strategy may already be working. We tested the podcast out on Aleksandra, a seventh-grader in Chicago, Ill. She listened to four episodes, including one about a researcher who made a plant’s root system glow by inserting a jellyfish gene. “They made me think that people can have very interesting jobs that people don’t know about,” she says. “Who would think to combine the genes of a jellyfish with a plant root?”
www.nasa.gov/audience/forkids/kidsclub/flash
Ask kids what they want to be when they grow up, and many will respond,
“an astronaut!” Now, these aspiring young adventurers have a
new site from which to explore outer space in cyberspace. NASA’s
recently launched “Kids’ Club” Web site, aimed at children
in kindergarten through fourth grade, is packed with fun activities and
games that teach children about space, while helping them develop valuable
skills.
On the site’s main page, three cartoon computer screens offer the
latest about NASA’s space exploration goals and activities. For example,
clicking on the middle screen opens the “Now in Space” feature,
which provides pictures and updates of current space missions. In July,
Now in Space featured the astronauts who traveled aboard the space shuttle
Discovery to the International Space Station that month.
The main page also offers a menu of games at five different skill levels.
At the most basic level, for example, younger children learn letters of
the alphabet as they load cargo into the space shuttle. At the intermediate
level, kids develop their math abilities while launching a rocket, or
exercise their memories and time-telling skills as they prepare an airplane
for takeoff. At the highest level, older children can play a trivia game
to test their knowledge of the solar system.
The site is intended for use at home as much as in the classroom.
fieldmuseum.org/exhibits/online_interactive.htm
Visiting a museum’s Web site usually lacks the same appeal of perusing
the fossils and artifacts in person. But whether you live within driving
distance of the Field Museum in Chicago, Ill., or not, browse this museum’s
Web site for interactive features you won’t find in the museum’s
halls.
From the site’s homepage, choose from eight listed expeditions to
follow scientists for a behind-the-scenes look at work both in the museum
and in the field. For example, click on Lance Grande to learn about his
journey locating and excavating fossils from a 52-million-year-old deposit
in southwestern Wyoming.
The Wyoming expedition begins with a series of animated generic graphics
that show how fossils are extracted from the Green River Formation. The
tour ends at a virtual field site, where you can click on designated portions
of the quarry to see videos of paleontologists extracting fossils, or
pictures of early Eocene turtle, fish and insect fossils (and the only
frog fossil) found in the basin. If you want to review a previous step,
however, be careful not to click the “go back” button on your
browser, or you will have to start the tour over from the beginning. Instead,
select a previous step listed at the bottom of the page under “process.”
For a look inside the museum, return to the homepage and click on “Bill
Stanley.” A video takes you into the mammal lab where Stanley shows
how scientists prepare samples for collection. From boiling the specimen
almost completely down to its bones, to allowing beetles finish the process
before the specimen is prepared for storage, the videos don’t leave
much to the imagination.
Beyond the expeditions, you can also explore “The Sue Files,”
a section of Web-based activities designed to show younger students the
detective work involved with a career in paleontology. A quick introduction
lists a fictional news story about the disappearance of a dinosaur expert,
and students learn about Sue, the Tyrannosaurus Rex, along the
way.
Overall, the site will most likely appeal to a younger audience, but browsers
of any age can find something of interest, such as the interactive exhibit
about chocolate.
www.ucmp.berkeley.edu/education/explorations/tours/geotime/geotime.html
Understanding geologic time scales and how geologists know what they know
about the planet might seem overwhelming to kids. To help teachers explain
the 4.6 billion years of Earth’s history, the University of California
at Berkeley has created a Web site devoted to teaching students in grades
5 through 10 all about geologic time and evidence for events in Earth’s
history. It also gives a quick tutorial on relative and absolute dating
techniques — the law of superposition and radiometric dating, respectively
— and why all this is important.
The site is separated into a teacher’s section and a student’s section. The student’s section is all activity-oriented, beginning with a game where kids put into chronological order various events of the last century, such as the invention of sliced bread and the Internet, and then does the same thing with Earth’s history, including when Archaeopteryx first wandered the planet and when Lucy (the African hominid) was around. It then moves forward through a variety of activities, which teachers can work alongside the students to finish.
One caveat: Students have to work through every single activity in order to move on to the next screen, so it can be time-consuming. But overall, the activity is designed to take less than an hour of class time. It can be done through the Internet or via CD-ROM, which is available from Berkeley.
www.eia.doe.gov/kids
If reading this month’s feature articles on oil left you with the
desire to teach your kids all about energy or if you need to brush up
on the basics, the Energy Information Administration’s Energy Kids
Web site is a good place to visit. Start with the energy facts section
and click on “oil” to learn about where oil comes from —
geographically and geologically — and some of its everyday uses.
There are also links to more detailed information, such as a primer on
gasoline prices, that might help older students with reports and projects.
Within the energy facts section, coal, natural gas and uranium are also
explored, as are some renewable energy sources, including solar and geothermal
energy. The fun and games section offers quizzes, puzzles and riddles
about energy sources. The history section includes a look at some of history’s
energy experts, such as Newton and Curie, as well as a timeline of important
historical events in history — for example, that the first commercial
nuclear power plant began operating in 1957.
Also be sure to check out the section for teachers, which offers diverse
classroom activities for grades K-12, as well as science fair projects,
links to more energy sites, and a glossary.
dsc.discovery.com/convergence/dinosaurplanet/dinosaurplanet.html
The Discovery Channel’s Dinosaur Planet Web site is a great place
for kids to learn about dinosaur life. Begin with the Interactive Dinosaur
Viewer for a good overall look at 20 of the giant creatures. Clicking
on one of the dinosaurs, the Iguanodon for example, will lead you to an
explanation of the creature’s name, its habitat and a brief paragraph
about its life. “Iguanodon” means “fluted tooth” and
it lived in Romania, France, Austria and Spain. If you want more information,
you can take a detailed tour of the creature’s body (such as its
horns or eyes), a sketch of the creature in motion or a size comparison
of it versus a modern human.
The site is easy to navigate, but does have one minor setback: If you
access the interactive viewer and enter the world of one dinosaur, clicking
on your “back” button will take you all the way out of the viewer.
You’ll then have to wait until it reloads until you can examine another
dinosaur.
If the interactive viewer leaves you wanting more, you can exit to the
main Web site to see which dinosaurs lived where — broken down by
continent — or you can take the “Cretaceous Quiz,” which
is more difficult than it might seem. (I would recommend perusing the
Web site before taking the quiz to increase your odds!) Dinosaur Planet
is a fun, informative site, but be forewarned, you need a high-speed connection
and the latest in flash technology for it to work well.
www.fema.gov/kids
Herman, the “spokescrab” for the Federal Emergency Management
Agency’s Web site for kids, welcomes young visitors to the site to
learn all about disasters — what they are, how to avoid them, how
to prepare for them, and how to get through them once they strike. With
a multitude of fun activities, including fun and informative stories such
as “The Disaster Twins’ Flood Story” and the “Shake
with a Quake Story,” young surfers will be excited to learn all about
earthquakes, wildfires, volcanoes, tornados, hurricanes and more. A cookie
sheet, dirt, twigs and string will teach kids how earthquakes really work.
Math quizzes help kids figure out whether there’ll be a big snowstorm
in their neighborhood this year. And a crossword puzzle teaches all the
buzzwords of disaster management. This site is a blast for both kids and
parents and teachers walking them through it!
www.kidscosmos.org/field-trip-to-mars.html
After you tour through the Mars rover mission, take a tour of Mars on
Earth! At the Kid’s Cosmos site, kids and adults alike can “buckle
up and blast off to Mars.” The site features two tours, one specifically
for kids and another, more in-depth trip. Both virtual tours seek to teach
visitors about the geology of both Earth and Mars by comparing geologic
features in Washington State to those on the Martian surface — volcanoes,
dust devils, sand dunes, canyons …you name it! The tours come complete
with trip mileage along Washington highways, a map of Mars and some lovely
photographs that highlight both the unique and the comparative formations
on each planet.
www.kids.rrc.state.tx.us
The Texas Railroad Commission recently unveiled the Kid’s World
Web site to teach children about energy resources. Marti and Molly Mockingbird
are your feathered tour guides through Kid’s World. Visit their home
to learn about the different ways we use energy every day. At the Mockingbirds’
school, you will learn about the history of the Railroad Commission and
link to energy-related resources and games. The school and campground
offer different views of energy use, and more games to engage the site’s
young audience. Also, check out “Spotlight on Kids,” where you
can meet local students who are learning about energy resources in their
schools.
www.epa.gov/globalwarming/kids
The EPAs Global Warming Kids Site is a fun and informative stop for any
young Web surfer. The site colorfully covers climate change basics explaining
the difference between weather and climate, as well as the greenhouse
effect and how scientists are researching climate issues. Click on The
Climate Detectives to learn about how researchers look for climate clues
in the sky, the ocean and in ice, sediments and trees. Kids will
have a blast on the sites game page, where they can test their climate
change knowledge in a challenging crossword puzzle or a grueling game
of hangman. The site also offers some green tips to show children
how they can make a difference.
www.usgs.gov/education/
Visit the United States Geological Surveys Learning Web site for
a K-12 interactive learning experience. The Learning Web has information,
games and resources for subjects about our natural world, including Geology,
Biology, Geography and Hydrology. The Geology section contains a range
of information on earthquakes, volcanoes, mineralogy, plate tectonics
and fossils. Kids (and grown-ups too) can click on the Earthquake page
for Earthquake ABCs, a glossary of terms and facts, or for a look at
Today in Earthquake History. Browse Kids Corner in the Biology section
for fun pages of coloring books, puzzles, stories and interactive games.
The Learning Web presents a diverse wealth of information that is fairly
easy to navigate and explore. I found it sometimes difficult to distinguish
the student links from the educator resource pages, but the pages are
well-worth the little bit of extra surfing.
vcourseware5.calstatela.edu/VirtualRiver/Flooding/
A great activity for kids, this Web site, supported by the National
Science Foundation, highlights river flooding, sediment deposition and
erosion. It presents a variety of lessons, including an interactive flood
plain image, quizzes on river processes and an image you click to measure
the area of a watershed. According to the site, most students can complete
this virtual lab in about an hour.
www.ZoomDinosaurs.com
Who named Tyrannosaurus Rex? Did Brachiosaurus care for its young? This
site can help students find those answers. Sponsored by EnchantedLearning.com,
ZoomDinosaurs provides easy-to-access information on more than a hundred
different dinosaur species, as well as a dinosaur dictionary and other
resources to make gathering information for a dinosaur report easy for
young students.
www.savageearth.com
This is a site created along with a summer 1998 PBS television series
on natural disasters. It is divided into three sections: tsunamis, earthquakes
and volcanoes. Each section gives a brief overview followed by links to
specific event information and clips of disasters-in-actionQuicktime
is required. The site sometimes overdoses on verbal hype ("tsunamis: waves
of destruction") but makes up for it in the close-up pictures of erupting
volcanoes and earthquake damage and the informative earthquake maps and
diagrams of plate motions at work. Put your kid at the monitor and let
her loose.
www.pbs.org/wnet/savageearth/animations/index.html
Teaching an intro geology course in the fall? Want your kids to understand
what your talking about when you point out a normal fault in a road cut
on your next family vacation? Direct them to this page on the PBS Web
site. It has great animations of difficult-to-explain geologic phenomena
such as dip-slip faulting, plate subduction, secondary and primary wave
propagation and several longer animations with detailed explanations of
the geologic processes. The animations are part of PBS Savage Earth section
of its Web site, which offers basic information on many different geologic
processes.
www.windows.ucar.edu
It's summertime — time to explore and leave your work behind, at
least for a few days of vacation … but, if you can't, try a fun Web
site, like Windows to the Universe, run by the University Corporation
for Atmospheric Research in Boulder. Offering a rich array of images,
animations, datasets and documents, the site looks at the cultural ties
between science exploration and history. It provides a wealth of information
on earth and space sciences — including information on every planet
in the solar system and what we know beyond. The "Amazing Water Facts"
page is a great page for reference, in case you cannot remember the longest
freshwater lake or the muddiest river in the world. Be sure to check out
the mythology section, where you can read up on lore from ancient societies,
including the Greek, Mamaiuran (an Amazon Indian tribe that lives in Brazil)
and Norse, to name a few.
This engaging site is mostly aimed toward kids, with beginning, intermediate
and advanced levels each corresponding to elementary, middle school and
high school reading levels, respectively. (I found that the major difference
among the levels was simply in text size on the screen.) But the site
has something for everyone — students, teachers and those looking
for some summertime Web fun.
Back to index
www.nextwave.org
Billed as the career development resource for scientists, Sciences
Next Wave, produced by the American Association for the Advancement of
Science, is one of the most comprehensive on the Web devoted to careers
in science and the needs and frustrations of young scientists. Although
it has a definite slant toward the life sciences (much to the same degree
as its parent journal Science), its advice is often broadly applicable.
www2.phds.org
The Science, Math and Engineering Career Resources site provides a comprehensive
list of more than 2,500 Web links related to science careers. The sites
self-described goal is to help students to prepare for the changing demands
of todays job market and to provide a voice for early career scientists.
A helpful feature is that the links can be sorted by user ratings or by
popularity.
www4.nationalacademies.org/osep/
cpc.nsf
Although the geosciences receive little attention on this site, The National
Academies Career Planning Center for Beginning Scientists and Engineers,
geoscientists could still benefit from a visit. The site allows job seekers
to explore job market trends and includes an advice center with the option
to contact a professional volunteer mentor in their field of choice. The
site is free, but it is necessary to register.
www.geosciencejobs.com
Search through international employment opportunities and resources for
geoscientists.
http://www.earthscienceworld.org/careers/
The American Geological Institute provides this Web resource for inquisitive
geoscientists at all career levels. The site offers career profiles, enrollment
and employment statistics as well as classified job postings. For those
considering grad school, the online Guide to Geoscience Departments provides
detailed descriptions of faculty and programs.
www.awg.org/eas/profiles.html
Association of Women Geologists page of careers in geology and profiles
of women in geoscience
www.earthworks-jobs.com
The Earthworks Web site offers job listings posted by employers in a multitude
of earth-science fields from around the world. Browse listings in environmental
science, postgraduate courses, soil science, geotechnical engineering,
petroleum engineering and many other fields. Job seekers can post résumés
on the site and employers can search the catalog of résumés
for potential employees.
www.geojobs.com
If youre looking to hire or get hired, check out the GeoJobs site hosted
by the Geoscience Information Center. The database lists about 100 applicants
and 500 jobs including internships, professorships, and commercial jobs.
You can search by field, state, country, job title or institution and
company.
Back to index
Atmosphere
www.climatescience.gov
In December, more than 1,200 scientists, industry representatives and
lobbyists met in Washington at a workshop sponsored by the Bush administration
to get feedback on a 177-page draft statement about U.S. climate change
research. At the U.S. Climate Change Science Web site, you can read this
strategic plan along with public commentary and related developments in
climate change policy.
Thirteen federal agencies sponsor the Climate Change Science Program,
which integrates federal research on climate change. Last month, the president
identified the climate change program as one of the key crosscutting initiatives
in the proposed fiscal year 2004 budget. The site provides a good overview
of the budget, recent structural changes in the program and text on where
the administration sees the future of climate change research, through
Hill testimony and supporting documents.
www.nhc.noaa.gov/index.shtml
This month marks the middle of the 2002 Atlantic hurricane season and
you can keep track of the latest developments in the air and seas at NOAA’s
National Hurricane Center (NHC) Web site. A list of all active tropical
systems opens on the site’s homepage. From there, you can link to
pages about how hurricanes form, the most recent forecasting models and
past hurricanes. You also can take a look at satellite and radar storm
imagery and sign up to receive NHC advisory e-mails.
www.epa.gov/globalwarming/kids
The EPAs Global Warming Kids Site is a fun and informative stop for any
young Web surfer. The site colorfully covers climate change basics explaining
the difference between weather and climate, as well as the greenhouse
effect and how scientists are researching climate issues. Click on The
Climate Detectives to learn about how researchers look for climate clues
in the sky, the ocean and in ice, sediments and trees. Kids will
have a blast on the sites game page, where they can test their climate
change knowledge in a challenging crossword puzzle or a grueling game
of hangman. The site also offers some green tips to show children
how they can make a difference.
adds.awc-kc.noaa.gov
The Aviation Digital Data Services Website is a weather information site
designed to provide pilots and air traffic controllers with up-to-the-minute
forecasts. Detailed wind, icing and other meteorological data is
available for current conditions and different forecast times.
www.nationalacademies.org/opus/elnino
This Web site, El Niño and La Niña, is produced by the National
Academy of Sciences Office on Public Understanding of Science and the
Academys Ocean Studies Board. It documents how decades of scientific
research have helped us understand the relationship between ocean and
atmosphere.
www.ngdc.noaa.gov/paleo/ei/ei_cover.html
If youre looking for graphical information on global climate change over
the last several centuries, this Web site might have what you need. The
publication Global Temperature in Past Centuries, by the National Oceanic
and Atmospheric Administration and several university scientists, can
be found online through the journal Earth Interactions. The focus here
is on some of the more unusual climate phenomena of the past several centuries.
Data were collected from tree rings, ice cores, corals, historical records
and lake sediments.
The home page is structured like a scientific paper, so if you are interested in the introduction, methods and references, those details are available. But if you only want to look for specific figures, graphs and maps, click on Temperature Reconstructions to browse through the graphs. Or, from the sidebar, choose Table of Figures to scan through a comprehensive list. A few of the maps and graphs available are: Northern Hemisphere average temperature trends from 1400 to 2000; Global temperature patterns for two historically documented, very strong El Niño events (1791 and 1878); and the annual-mean global temperature pattern for 1816, the year without a summer.
You might consider avoiding the unnamed animation that
can be found under Spatial Patterns (part B) of Temperature Reconstructions.
It took more than ten minutes on a computer with a fast Internet connection
to download half of the images necessary to run the animation. Also, the
home page, or Cover Page of the paper, claims the Web site interactivebut
links dont really make a Web site interactive
do they?
Back to index
wrgis.wr.usgs.gov/docs/parks/cave
The U.S. Geological Survey (USGS) and the National Park Service (NPS)
have collaborated to create the Geology of Caves Web site. From describing
how caves form to their scientific, aesthetic and recreational values,
the site links to detailed explanations and features some good basic diagrams.
The site can also take you on a virtual tour of Mitchell Caverns in the
Mojave Desert in California — known for its distinct dripstone formations,
called speleothems, that adorn the cave walls. The Geology of Caves Web
site is a good first stop on your underground adventures.
www2.nature.nps.gov/grd/tour/caves.htm
After learning all about speleothems, you can actually see the stalagmites
and stalactites in action through NPS online geology tours of cave and
karst parks in the United States. The tours extend from the famous Carlsbad
Caverns in New Mexico to Russell Cave National Monument in Alabama. You
can also tour lava tubes, karst features and one sea cave, Point Reyes
National Seashore in California. Every tour includes photographs, geological
descriptions of the formations and extensive resource libraries, as well
as information about visiting the park in person — lots of fodder
for some vacation ideas with spring just around the corner.
www.goodearthgraphics.com/virtcave
The Virtual Cave site lets you explore four different types of caves.
Detailed text and photos explain sea caves and erosional caves. Solution
caves and lava tube caves have clickable image maps linking to more info
on soda straw stalactites, Baldacchino canopies, cauliflower Aa lava and
tubular lava helictites. A fast Internet connection is a plus these
photos may take a while to download.
Back to index
www.earthlab.com
During the past year, climate change has been a hot topic, and the catchphrase “carbon footprint” has found its way into everyday conversation. We each contribute to the release of carbon dioxide, one of the greenhouse gases that contributes to global warming. Our contribution can be direct — from respiration all the way to the emissions from our cars — or indirect — such as emissions from factories to agriculture that produces our food. Combined, these direct and indirect emissions add up to our carbon footprint.
The recent increase in public awareness of human-induced climate change has triggered many people’s interest in learning more about their own impact on the environment, and the Internet offers many tools designed to help people calculate their carbon footprint. Curious about my own carbon footprint, I gathered together my electric and gas bills and checked out EarthLab (www.earthlab.com), one of the newest additions to the growing collection of Web sites offering online carbon calculators.
Like many online calculators, EarthLab can only really estimate my direct emissions — it’s just way too difficult to try to follow the trail of my indirect emissions — and measures it in terms of yearly tons of carbon dioxide output. The first bit of information EarthLab needs from me is my zip code. This will help the calculator determine carbon dioxide emissions from my energy use, as different regions use different sources of energy, such as coal or nuclear power, to generate electricity, which in turn vary in how much carbon dioxide they emit. EarthLab also asks me about my average monthly electric bills, and if applicable, my average monthly natural gas, oil or propane bills as a proxy for the actual amount of energy I consume. I also report at what temperature I keep my thermostat, if I use energy efficient lighting and what percentage, if any, of my energy comes from renewable sources. (If you don’t know, you can leave that question blank, or check with your electric company.)
After answering these questions about my use of energy at home, EarthLab asks me about my travel. First, it asks how many miles per year I drive, and the year, make and model of my car to estimate its fuel efficiency. It also asks me how I commute to work each day as well as how many airplane trips I take each year.
From all of these questions, EarthLab estimates that I directly contribute nearly six tons of carbon dioxide to the atmosphere each year, which isn’t bad, apparently: The average yearly output of carbon dioxide for an American is nearly 15 tons of carbon dioxide per year, according to EarthLab. Perhaps my fuel efficient car and the fact that I take public transportation to work keeps my carbon dioxide emissions low.
The creators of EarthLab weren’t content with just showing people their carbon dioxide emissions, however. While creating EarthLab, “we thought there were some excellent calculators out there,” says Duane Dahl, a Web entrepreneur and creator of EarthLab. But “what was missing was the next step,” which is to help people to understand what they can do to reduce their footprints, Dahl says. For that, EarthLab allows you to save your results and update them over time, which lets you track your improvement, he says.
In addition, EarthLab also calculates your Earth Conservation Plan (ECP) score. Your ECP takes into account your carbon dioxide output as well as a variety of lifestyle behaviors — such as buying organic food — that may reduce or offset your carbon dioxide emissions. Once your carbon dioxide output and ECP scores are calculated, EarthLab offers a variety of suggestions, or pledges, for ways to reduce your scores. For example, I pledged to buy online music instead of CDs. This will lower my indirect emissions because I will not be contributing to the carbon dioxide that is emitted from trucks used to transport CDs or the plastic used to make the CDs. I also pledged to unplug my cell phone charger when I’m not using it and to let my dishes air dry instead of drying them in the dishwasher. Once I confirm that I’m indeed abiding by my pledges, my ECP score will drop. Also, as I implement my various pledges, I should see changes in my electric bill over time, which should lower my carbon dioxide output in the long run.
Dahl himself admits he has a long way to go to reduce his own impact on the environment, saying his wife has always been the “green” one in the family. But as he’s learned more about climate change while developing EarthLab, he’s realized that reducing greenhouse gases isn’t just about buying hybrid cars. “There are hundreds of things we can all do,” he says, which is what he hopes people will learn from a visit to EarthLab.
Visit EarthLab or any number of other carbon calculators to learn how much carbon dioxide you’re already putting into the environment and how to reduce your footprint. Although some are better than others, they are all fun and informative.
www.wri.org/usenergyoptions
In a time when oil prices are near historical peaks and geopolitical tension in oil-producing countries such as Venezuela, Iran and Nigeria makes supply uncertain, any discussion of energy options includes a discussion of energy security. Of course, given the recent focus on climate change, such a discussion also includes what that choice means for the environment. If the United States chooses to go with a particular energy solution, such as a renewed push for nuclear energy, for example, what would be the implications? It might mean that carbon emissions decline, but it might also increase the risk of a terrorist attack on the new plants.
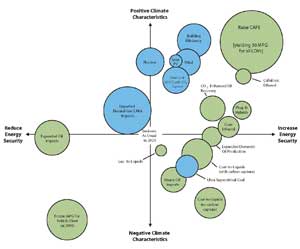
These and other tradeoffs and impacts of energy options are explored in a new chart created by researchers at the World Resources Institute (WRI) in Washington, D.C. The interactive chart illustrates the projected energy security and climate characteristics of different energy options, from raising fuel efficiency standards to increasing liquefied natural gas imports, in 2025. The point of the graph, says Jeff Logan, senior associate with WRI’s climate and energy program, is to create “a platform to discuss how we value the different energy options at our command.”
The center point of the graphic represents a business-as-usual approach — if we were to change nothing by 2025 — with the two axes labeled climate characteristics and energy security. Each bubble represents a particular energy technology or policy option, and the size of each bubble represents how much energy the option could deliver or offset compared to business-as-usual, given a modest policy push, says John Venezia, another WRI scientist involved in creating the bubble chart. Policy pushes could be general, such as introduction of a “cap-and-trade” carbon target, he says, or specific, such as a renewable energy tax credit. The chart is divided into four quadrants. Click on any of the bubbles in a quadrant to learn more about that particular energy option. Energy options in the top right quadrant, such as renewable fuel choices, plug-in hybrid cars and increased vehicle fuel efficiency, have both positive energy security and climate characteristics.
“Raising CAFE” — the fuel efficiency standards for our vehicles — stands out on the chart as the biggest bubble and highest in terms of increasing energy security and promoting a cleaner environment. Raising car mileage requirements even modestly is the single most powerful measure the United States could undertake to advance energy security and climate interests, Logan says.
The bubble representing liquefied natural gas imports also stands out. As natural gas is cleaner burning than other power sources such as coal, it represents a positive climate choice. However, “there is uncertainty in how much natural gas will be dependably available in the world,” Logan says. Because natural gas in large volumes is only available in a handful of countries, limited suppliers could influence the market much like OPEC has done with oil. So, liquefied natural gas appears in the top left quadrant, representing a choice that actually reduces energy security.
Although the chart and corresponding report include many different factors, the results are not based on integrated modeling or forecasts, Logan says. The researchers did, however, consider the costs and feasibility of these various options through 2025, he adds, which is part of the reason that a technology such as a plug-in hybrid car has a relatively small bubble.
The point of the chart, Logan says, is simply to make people aware of the tradeoffs of various energy choices and to provoke discussion. It’s a chart worth checking out.
carbonfund.org
The average American contributed almost 20 metric tons of carbon dioxide,
one of the leading greenhouse gas emissions, to the atmosphere in 2003,
according to Energy Information Administration statistics. Helping individuals
or companies to offset their impact, or “carbon footprint,”
is the mission of this donation-based Web site. Carbon-reducing activities
that the site supports include renewable energy projects, such as the
Highmore Wind Farm in South Dakota, and carbon sequestration projects,
such as tree planting in forests in Montana and Arkansas.
The homepage features the carbon calculator, which lets you determine
how many tons of carbon dioxide you produce in one year. Simply enter
the amount of electricity, natural gas and heating oil you consume, as
well as distance you travel by vehicle and airplane. The estimated number
of tons of carbon dioxide from your activities appears in the box below,
as well as the cost that the site says is needed to offset your impact.
If you do not know a specific piece of information, numbers for the average
person are provided for you.
The site also contains useful information about carbon dioxide and its
relationship to global warming. Clicking on the homepage’s “CO2 causes Climate Change” link leads to additional links that describe
what is known and unknown about climate change, as well as energy consumption-reduction
tips and lifestyle changes that can reduce your carbon dioxide impact.
www.gasbuddy.com
High gas prices have consumers looking for the best deals at the pump.
To make that search easier, stop by the Gas Buddy site — one of a
growing number of sites of its kind — to see if real-time prices
are listed for your nearby gas stations.
From the U.S. map on the homepage, click on your state and select a site
from the list of that state’s regions. Then scroll down to “search
for gas prices” and select a city and “all stations.” Click
“search now,” and a list appears that ranks gas prices (from
lowest to highest) next to the station and its street address. Only prices
for the past 24 hours are listed. The site also allows browsers to specify
a particular station.
Searching all stations, however, might be your best bet. The site depends
on its users to enter price updates, which means that some stations (especially
in rural areas) are not accounted for. Also for this reason, the site
does not assume responsibility for any price inaccuracies.
Before rushing out to take advantage of a good deal, however, take a moment
to browse the site’s extra options. They include a chart that displays
gas prices for the last month, helpful gas-saving tips and links to recent
media coverage of gas issues. Also, take part in an opinion poll or view
archived polls. One poll in November found that 42 percent of those responding
would drive roughly an extra 10 to 20 kilometers or miles for cheaper
gas.
www.uky.edu/KGS/pubs/lop.htm
In July, the Kentucky Geological Survey (KGS) launched the country’s
first free, Web database of a state’s oil and gas records. The site
contains information on more than 150,000 oil and gas wells drilled in
Kentucky, including scanned-in images of geophysical logs. The logs are
long documents, up to 100 feet in length, that record rock properties
and show findings at various well depths.
Previously, if you needed well information, you had to contact KGS or
travel to its local offices in Lexington or Henderson. Now the data are
electronically accessible. KGS hopes this online accessibility will help
industry increase production of oil and gas in Kentucky — exploring
both new sources and older fields that might offer new prospects. Electronically
archiving these records from the Commonwealth of Kentucky’s extensive
paper archive took more than 20 years and about $10,000 in new equipment.
The site is fairly user friendly. With a simple download of specific image-viewing
software, you can view scanned records from oil and gas wells in a specific
quadrangle of Kentucky — geophysical logs, permitting documents and
helpful information about how to navigate through the records themselves.
The site also provides a useful map for more precisely locating the wells
within Kentucky counties.
www.nrel.gov
Explore the latest developments in renewable energy at the National Renewable
Energy Laboratory’s (NREL) Web site. In March, U.S. political leaders,
scientists and engineers met in Washington to discuss the role of distributed
energy resources (DER) — small energy systems placed at or near the
points of use. At the NREL Web site, you can learn about the latest DER
and renewable energy technologies and how they may help to increase U.S.
energy security. Managed by the Department of Energy, the site also covers
clean-energy basics and information about the 25-year-old national laboratory.
www.kids.rrc.state.tx.us
The Texas Railroad Commission recently unveiled the Kid’s World
Web site to teach children about energy resources. Marti and Molly Mockingbird
are your feathered tour guides through Kid’s World. Visit their home
to learn about the different ways we use energy every day. At the Mockingbirds’
school, you will learn about the history of the Railroad Commission and
link to energy-related resources and games. The school and campground
offer different views of energy use, and more games to engage the site’s
young audience. Also, check out “Spotlight on Kids,” where you
can meet local students who are learning about energy resources in their
schools.
www.rigmatch.com
An online intelligence service for the oil and gas industry. Features
a search engine that targets energy industry sites. Use it to research
competitors, suppliers, rare parts and drilling activities in the Gulf
Coast area.
www.energynet.com
EnergyNet.com provides real-time auction services to the oil and gas industry.
The Texas based company lets the sellers determine the length of auction
for each property or lot posted and buyers can bid from their computers
24 hours a day.
www.oilsurvey.com
Oil Survey is an independent oil and gas information Web site that links
to over 11,000 sites with information relevant to the worldwide industry.
Search the site for information on companies, jobs, products and services,
news, books, reports and patents, and other various industry facts.
www.getenergysmart.org
Believe it or not, there is a fun way to take a look at your energy consumption
habits and find ways to slash your energy bills. The New York State Energy
Research and Development Authority maintains a Web site that provides
useful information for anyone interested using energy more efficiently.
Some features apply only to New York state residents, but most are universal.
Perhaps the most enjoyable applies to anyone, anywhere. The Energy Smart
University may be a virtual-school, but it does provide an education.
Take a few classes and try out a few labs{{emdash}} all will provide
a few tips about smart energy consumption. From the campus map, enter
the Science and Technology building (all that takes is a mouse click
on the picture of the building). Lab 2 features a house with two floors,
several rooms and lots of appliances. Turn the appliances off and on and
watch the energy bill soar and plummet over seconds, minutes, hours, days,
months or years to see how to save money on your energy bill.
www.eia.doe.gov
The Energy Information Administrations Web site provides the public with
the U.S. governments official energy statistics. From the home page,
visitors can ask an energy expert a question, browse down to Featured
Publications to bring up recent monthly energy statistics or access information
on topics such as processes, environment, price or geographyjust to name
a few. If you cant find what youre looking for by searching or
browsing this Web site, give one of the experts a call. Theyre happy
to help you access whatever information you might need. Or if all else
fails, take a look at the Energy Links and search similar Web sites.
www.wims.uwyo.edu
The Wyoming Oil and Gas Resource Mapper is a printable, GIS-style, interactive
map of Wyoming. The map includes the usual cities and roads, and also
irrigated agricultural land, golf courses, precious metal deposits, geothermal
energy, oil and gas wells, faults, bedrock geology, and limestone quarries.
Be warned though. The site is a bit unwieldy. The map takes about 30 seconds
to redraw itself between each modification, and some colors are hard to
see against the background. Still, if you've got a fast Internet connection,
a good monitor, and an interest in Wyoming, its a fun site.
www.fe.doe.gov
The Department of Energy’s (DOE) Fossil Energy Web site features
news on the latest developments on the U.S. energy front. Here you can
read in-depth profiles of the president’s energy plan, the country’s
emergency energy stockpile, clean-coal technology and carbon sequestration
options. The site describes geologic, ocean and terrestrial sequestration,
and updates you on the status of research and development. The jazziest
section of the Fossil Energy site is the “For Students” section,
which lets students “look down” an oil well, “feel the
blue flame” of natural gas and understand new efforts to clean coal
technology. Fun animations and easy navigation make this section a worthy
stop for those just getting started learning about energy resources.
Back to index
www.climatechange.gc.ca/english
For a good overview on climate change, such as a broad definition of the
phenomenon and a succinct explanation about greenhouse gases and Earth’s
greenhouse effect, visit the government of Canada’s climate change
Web site. Not only does the site discuss the basics, but it also delves
deeper into what some effects might be locally and globally, and what
each individual can do to help reduce greenhouse gases. The One-Tonne
Challenge is a program that asks all Canadian citizens to do what they
can to reduce their own annual greenhouse gas emissions by one metric
ton. While the challenge itself is only offered to Canadians, there are
many suggestions for people living anywhere, such as reducing the time
you idle in your car and turning down your thermostat when you are away
or at night.
The site also offers resources for teachers to educate their students about climate change, with links to curricula for various age groups, games and activities for students, and school project ideas. The government also offers a climate change teachers kit that educators can request to receive.
cfpub.epa.gov/si
The Environmental Protection Agency’s new Science Inventory Web site
is a public, searchable, agency-wide catalogue of peer-reviewed publications
and current science activities, including ongoing research and technical
assessments. Containing more than 19,000 records in the database, the
site is a veritable one-stop shop for any desired EPA activity information.
cdiac2.esd.ornl.gov/index.html
Another DOE site looks solely at carbon sequestration. Created by the
DOE’s Office of Science, this simple site lists DOE carbon sequestration
centers, contacts, recent reports, upcoming meetings and research opportunities
— a good resource for those involved in carbon sequestration research
or related projects.
www.netl.doe.gov/coalpower/sequestration
If you aren’t carbon-sequestered-out, visit the National Energy Technology
Laboratory’s Web site devoted to all things … carbon sequestration.
This attractive site is loaded with great information about the goals
of carbon sequestration projects and the different methods researchers
are investigating. It also features a section for younger Web surfers.
Of note here are the video clips, which teach kids the basics of carbon
sequestration through a conversation between two young children and their
mother. Enhanced with animated graphics and illustrations, this is a not-to-be-missed
feature. And both the kids section and the main site offer up great Web
references for anyone interested in learning more about the complex world
of carbon sequestration.
www.nammu.com
A comprehensive global environmental, health and safety resources Web
site that provides a variety of services including news, a career center
and an online marketplace.
www.cool-companies.org
A Web site designed to teach companies how to boost profits and productivity
by cutting greenhouse gas emissions. Provides strategies, tools
and information to reduce emissions.
www.enviroglobe.com
Provides work-focused environmental business information and resources
related to areas such as pollution prevention, environmental insurance,
career services and cost estimating.
www.cnie.org/nle
Looking for credible Web sites to suggest to students beginning research
on an environmental topic? The National Council for Science and the Environments
National Library for the Environment Web site links to myriad environmental
resources including news sources, a yellow pages directory of environmental
contacts and Congressional Research Service Reports. Click on Researchers
Bookmarks to view links to information on international environmental
treaties, state and federal agencies, environmental laws, online library
catalogs, and search engines.
www2.nature.nps.gov/grd
Take a tour of one of our nations national parksor at least a virtual
onethrough the Park Geology section of the National Park Services Web
site. The tour section offers information on the geology of each park,
in addition to wildlife, visitor information and a photo gallery. Tours
are grouped according to geologic formation or history. A section on plate
tectonics provides links to parks grouped under subheadings that pertain
to North Americas tectonic history. For example, under Ocean-Continent
Subduction Zones, you will find Active Volcanic Arcs, Ancient Arcs, Low-Angle
Subduction Zones and Accretionary Wedges. Each subheading is followed
by a list of links to National Parks that fall within those geologic regions.
Attaching a known location to an abstract geologic concept makes this
Web site particularly useful. Its difficult to imagine what really happens
during low-angle subduction, but a familiar sight makes the concept seem
a bit more tangible. This Web site could be a useful classroom tool.
www.iraqfoundation.org/projects/edenagain
Learn about restoration of the Mesopotamian marshlands in modern-day Iraq
and Iran on the Iraq Foundation’s Web site. Devoted to the Eden Again
project, the Web site offers a cultural and environmental history of what
used to be 20,000 square kilometers of interconnected lakes, mudflats
and wetlands, and details the devastation on the Iraq side in the 1990s.
The site is up to date, with news and information related to the restoration
project, and provides many links to other sources, including Iraqi environmental
sites, Middle East stability sites and the United Nations Environmental
Programme.
www.unep.org
Effects from rising temperatures are most evident at Earth’s poles,
but an outlook released June 5 by the U.N. Environment Programme (UNEP)
emphasizes that desert regions are also feeling the heat, and could begin
to run out of water.
UNEP has taken the first step in recognizing the desert water crisis by
designating 2006 as the “year of the desert.” The release of
the Global Deserts Outlook coincided with World Environment Day, which
since UNEP’s inception in 1972 has focused on bringing worldwide
attention to environmental issues of concern. On the UNEP Web site, you
can check out the details of the report featured under the “publications”
link. Here you will learn how climate change may affect deserts, which
cover about one-quarter of Earth’s surface and support more than
500 million people.
After browsing the report, return to the site’s homepage and select
from the wide range of issues tackled by UNEP and depicted as thumbnail
images: everything from biodiversity to ozone. Select any of these “focus
areas” to find out about UNEP’s involvement.
Click on “Sports & Environment,” for example, to read about
how UNEP contributed to the Green Goal initiative at this year’s
soccer World Cup. Officials aimed to make this year’s games, held
in Germany, “climate-neutral.” To make that happen, the Kaiserslautern
stadium roof was lined with 5,000 solar panels that supply an estimated
720,000 kilowatt-hours of electricity to the grid — enough to supply
200 homes.
To find UNEP’s latest report or announcement, click on the homepage’s
“news center” link. Most stories are accompanied by strikingly
moving photographs, which have also been compiled into Focus on Your World,
and are reason enough to visit the site.
Back to index
Mapping
http://erg.usgs.gov/isb/pubs/MapProjections/projections.html
While navigating a road trip, drivers today may turn to GPS systems in
lieu of the antiquated paper road map, tucked away somewhere in the back
seat pocket, never to be seen again. Still, an age-old challenge remains:
how to turn a 3-D globe into 2-D maps. The U.S. Geological Survey’s
(USGS) Map Projections Web site offers a look at how the transformation
is accomplished.
The site is laid out in a simple, single page that describes the main
methods of map-making along with their advantages and disadvantages. Various
types of maps can provide a combination of true direction, distance, area
or shape, but never all at the same time, due to inherent distortion.
The single exception is the globe. But even it has its disadvantages,
according to the site, such as that globes show small amounts of detail,
are bulky, not easily transportable and expensive to reproduce and update.
Next, the site lists descriptions of various flat map projections, starting
with the common Mercator map. This type of map is created by wrapping
flat paper such that it forms a cylinder around the globe. Features from
the globe are then mathematically projected onto the paper, which is then
unfolded and can lay flat. This type of map works well for navigation,
as its angles and shapes in a small area are fairly accurate, although
areas and shapes distort as you move away from the equator. Read on to
learn how USGS adapted the Mercator method to map images collected by
Landsat satellites as they orbit Earth.
You can also learn about the “sinusoidal equal area map” used
by USGS to show distribution patterns, such as hydrocarbon provinces and
sedimentary basins. Areas on this map remain proportional to areas on
Earth, although shapes can be distorted.
For a quick breakdown of which map best retains area, direction and distance,
scroll down the page to the summary tables. The main types of projections
are listed here along with a chart that makes it simple to find out which
map will best suit your needs.
If any of the map-making jargon should throw you off, refer to the bottom
of the page for definitions of words such as “conformality”
and “graticule.” The list is limited to eleven words, however,
leaving anyone new to the world of maps still searching for a dictionary.
http://science.nasa.gov/realtime/
To follow the action continuously taking place in Earth’s orbit,
check out NASA’s satellite tracking Web site, designed to map the
real-time position of satellites and other spacecraft. Check out the current
position and path of your favorite Earth observatory, the International
Space Station, or the space shuttle.
The home page of this site offers a variety of tracking applications.
Click on “Live 2-D Java Satellite Tracking Maps,” for example,
to locate space-based astronomy observatories, such as Hubble and Chandra,
or Earth observation satellites, including Icesat, Terra, and even Landsat
7. Or, click on the second application, “Human Space Flight’s
Tracking Map,” to follow the International Space Station and, when
flying, the space shuttle.
One of the site’s most popular tracking applications, according to
NASA, is the live 3-D display of 900 of the thousands of satellites buzzing
about Earth. Zoom in or out on any satellite, or click on the display
screen to rotate the view in any direction. To find out the name of any
of the hundreds of white dots, simply click on it.
If dots on a computer screen seem dull, click on “sighting opportunities”
to find out when you can catch a glimpse of the actual space station or
a space shuttle as it passes overhead. Simply select your location from
a list, or enter your zip code, and the Web site does the work of compiling
dates and times that the objects will be visible — assuming, of course,
you have clear skies.
http://earthnow.usgs.gov
Right now, orbiting somewhere above Earth, a Landsat satellite continuously
records its bird’s-eye view of Earth’s surface. Since 1972,
Landsat satellites have collected a vast number of such images, which
researchers have used to compare landscape changes over time — from
the declining levels of Arctic ice and forest cover, to the recovery of
a forest after a fire. Now, the U.S. Geological Survey (USGS) invites
audiences to eavesdrop on Landsat via home computers, to see what Landsat
sees in real time, via the EarthNow! Web site.
USGS currently operates Landsat 5 and Landsat 7, one of which is featured on the site’s home page at any given time. This page displays a continuously scrolling image viewer that shows the surface of the United States as seen from Landsat. Names of cities and towns appear on the image in blue text. Many U.S. locations look the same, however, so the page conveniently includes a U.S. map, on top of which the satellite’s current position and projected orbit are noted.
Unfortunately, the real-time images are only available when one of the satellites is within range of a specific USGS ground station. When the satellites are out of range, the image viewer replays the last data received and the word “Replay” will appear under the map, along with the time of the next expected real-time show.
The USGS Earth Resources Observation System (EROS) center
first launched the EarthNow! image viewer Nov. 2, 2006. Then, on Nov.
11, 2006, a viewing system was installed and launched at the Air and Space
Museum in Washington, D.C.
geology.com/meteor-impact-craters.shtml
If you want to visit the 170-kilometer-wide Chicxulub impact crater, but
the Yucatán Peninsula in Mexico is too far to travel, visit this
Web site. Without leaving your computer, you can browse 19 of Earth’s
most significant impact craters via an interactive Google map on geology.com.
The main page features a world map speckled with red balloon icons, which
mark the location of a crater. Click on a balloon, and a text window appears
with the crater’s name, location and size. Next, use the navigation
tools in the upper left corner to zoom and scroll. You can also click
the buttons in the upper right corner to switch between viewing an impact
on a map with boundaries, on a satellite image, or on a combination of
the two.
Not all craters are visible after zooming — some are underwater or
are obstructed by sediment — and the text on the world map that warns
about which are visible is difficult to read. Also, the Web site leaves
you having to search elsewhere for information about the date and scientific
significance of each impact.
Despite the drawbacks, the crater images alone make the Web site worth
browsing. The overhead view successfully makes you feel as if you were
flying above each crater — an experience that most encyclopedia entries
do not provide.
www.ghcc.msfc.nasa.gov/archeology
Remote-sensing technologies offer archaeologists the opportunity to detect
impacts of ancient human actions upon the environment, impacts that are
often invisible to the naked eye. NASA's Web site on the use of remote
sensing in archaeology is fascinating. The site describes how archaeologists
are using remote sensing as a methodological procedure for detecting,
inventorying and prioritizing surface and shallow-depth archaeological
information in a rapid, accurate and quantified manner. The site explains
how, through these technologies, archaeologists study soils, hydrology
and ancient tectonic events. You can learn how ancient communities lived
and adapted, for example, following repeated volcanic explosions in Costa
Rica. You can also read about some of the locations in which remote sensing
has already been put to work, including Chaco Canyon in New Mexico and
regions in northern Guatemala. And if you're still looking for more information,
the Web site also links to archaeology sites all over the world.
www.ccrs.nrcan.gc.ca
Canada’s Centre for Remote Sensing Web site details its remote-sensing
activities and includes a handy remote-sensing dictionary, a gallery of
images and links to many other remote-sensing Web sites. Several fact
sheets cover the center’s activities on remote-sensing usage in modeling,
monitoring and mapping climate change; developments in land, water and
man-made features; and natural hazards. Included in the learning resources
section are tutorials on the basics of remote sensing and then more detailed
publications, educational resources for undergraduate and graduate students,
and a special section for teaching children about the planet through remote
sensing. An image interpretation quiz asks questions about interpreting
surface features, teaching the difference between aircraft and satellite
imagery.
www.geocommunicator.gov
Last fall, the Bureau of Land Management and the USDA Forest Service launched
the Geocommunicator Web site. This interactive, land-information site
is the first module of the National Integrated Land System project. Geocommunicator
creates a virtual land community where you, at no cost, can subscribe
to receive updated datasets, new maps, and activity and event notifications
for a particular geographic region. The GeoCom Explorer tool allows you
to point and click on spatial views of a specific area and provides access
to a wide range of data, from static map images to lists of contacts for
the region. The site also features a forum where you can share information
and ask questions. View the data with a conventional Web browser or with
GIS software.
The site was a little tricky to get started with, and printing pages proved
difficult. However, it is a clearinghouse of geographic information that,
with a little patience and experimentation, is worth the wait.
www.geology.wisc.edu/~maher/air.html
It’s “Geology by Lightplane” on this photography site by
Louis Maher Jr., a professor at the University of Wisconsin. Tour through
36 years of aerial photographs, organized geographically by flight. Maher
has made his copyrighted photos available to the public for geological
education. View the photographs on the main site and then download detailed,
2000-pixel-wide JPEG versions from an FTP site. The pictures range from
views of the wave refraction off Lake Michigan’s shore to sights
of the windblown sands of the Great Sand Dunes National Monument, providing
an interesting birds-eye geological perspective.
www.cageo.com/afghan_geo.htm
The geology of Afghanistan consists of a succession of narrow, northeast-trending
terranes of continental fragments that range from Paleozoic to Tertiary
age. Computer Applications Geoscience (CAG) now offers an online look
at Afghanistans structurally complex geology. At the CAG site, you can
view and download a map that shows the geologic make-up of Afghanistan.
You also can link to an Afghanistan Map Collection at the University of
Texas and various news stories related to how geology is helping the United
States in its war against terrorism.
www.terrafly.com
Developed by the U.S. Geological Survey and IBM, this site gives you a
birds-eye-view of the United States. Type in a street address or
choose a locale offered on the Web site and view your town or city as
though you were soaring overhead. You can zoom in and out, check your
latitude and longitude and change your flying direction. The Java applets
that run on this site make it somewhat slow to load and there is a noticeable
delay when you try to navigate. However, while sitting at your desk, its
the closest thing to flying.
www.geo.edu.ac.uk/home/giswww.html
The Association for Geographical Information of the U.K. and the University
of Edinburgh have compiled a list of links to various GIS Web sites. The
comprehensive list covers government and private sector sites from around
the world. This site is a good starting point if you plan to search for
GIS information on the Web.
www.nima.mil
The U.S. Board on Geographic Names publishes the Foreign Names Information
Bulletin to provide the latest information on political geography.
Up-to-date names of countries and other geographic features are available
online by selecting Maps and Geodata and then GEOnet Names.
www.nationalatlas.gov
The USGS published the original National Atlas of the United States in
1970, and in 1997 the agency began compiling a digital database now available
at no cost on the Web. The site allows you to customize your map by zooming
in and out and downloading different informational layers via FTP (file
transfer protocol). Choose your geographical focus and then download information
on ferrous mineral mine locations, nuclear waste sites, per capita income,
butterfly distribution, watershed boundaries or one of many others.
www.wims.uwyo.edu
The Wyoming Oil and Gas Resource Mapper is a printable, GIS-style, interactive
map of Wyoming. The map includes the usual cities and roads, and also
irrigated agricultural land, golf courses, precious metal deposits, geothermal
energy, oil and gas wells, faults, bedrock geology, and limestone quarries.
Be warned though. The site is a bit unwieldy. The map takes about 30 seconds
to redraw itself between each modification, and some colors are hard to
see against the background. Still, if you've got a fast Internet connection,
a good monitor, and an interest in Wyoming, its a fun site.
Oceans
4dgeo.whoi.edu/panama
This year may have marked the end of the planetary road for Pluto, the
space object now known as a dwarf planet (see Geotimes,
October 2006), but it also marked what is just the beginning of an
adventure for PLUTO, the underwater observatory. From the observatory’s
Web site, you can join PLUTO — short for Panama Liquid Jungle Laboratory
Underwater Tropical Observatory — at its station 18 meters below
the surface of the sea.
In January, scientists from Woods Hole Oceanographic Institution in Massachusetts
deployed PLUTO off the west coast of Panama. The unmanned observatory,
the first in tropical waters, is located on the seafloor and is connected
via a 1.3-kilometer cable to an onshore facility that provides power and
receives data. PLUTO is fitted with a camera and sensors that measure
salinity, temperature, pressure, currents, pH, chlorophyll, turbidity,
light levels and oxygen. As such, it provides scientists with an unprecedented
ability to constantly monitor a tropical marine environment.
The images and data collected from the observatory are posted on the Web
site for scientists and nonscientists alike. For instance, on the site’s
homepage, you can view real-time shots from PLUTO’s camera. Or, click
on the “Photos” link in the main menu to view older images,
including some of PLUTO itself. Similarly, the “Live Data” link
will take you to a page with real-time measurements as well as graphs
that track measurement changes over the past 12 hours.
Ocean aficionados may enjoy visiting this site for fun, but teachers will
likely appreciate this site for its potential to be used in the classroom.
www.mos.org/oceans
The Oceans Alive! Web site, run by the Science Learning Network and the
Museum of Science in Boston, provides visitors with a strong start to
learning about Earth’s oceans. The site begins with very basic facts,
such as that oceans cover 71 percent of the planet, and ends up with details
about current scientific exploration and research under the sea, including
the latest data from submersible vehicles and how remote sensing has helped
map seafloors. In between are explanations of the water cycle, water currents
and El Niño, waves, tides and biology, as well as a clickable map
with fun facts about each ocean.
Teachers and parents, take note: This site is simple and informative and
could be an excellent tool for school projects!
oceanexplorer.noaa.gov
NOAA’s Ocean Explorer Web site offers surfers a window into the exciting
world of marine research and exploration. You can peer at marine plants
and animals through photographs and video streams, read about NOAA’s
200-year history, access 85 hands-on lesson plans developed by scientists
and educators during the 2001 and 2002 field seasons, and learn about
professional development opportunities. Be sure to check out the “Explorations”
section, where you can follow the day-to-day progress of NOAA expeditions
— complete with mission plans, photographs, logs and explanations
of the scientific processes. Recently awarded Scientific American’s
2003 Sci/Tech award for Web sites, the Ocean Explorer site is a visually
engaging treat for all interested in the ocean sciences.
www.acnatsci.org/research/anserc
The Academy of Natural Sciences, based in Philadelphia, has a unique gem
in St. Leonard, Md. — the Estuarine Research Center (ANSERC). A private,
nonprofit laboratory, ANSERC focuses on understanding marine and coastal
ecosystems. The lab, situated on the Chesapeake Bay, celebrated its 35th
anniversary last year and stands at the forefront of research on how humans
affect the marine environment. The scientists there investigate everything
from overfishing and development to pollution, such as mercury contamination.
Visit the Web site to get a flavor of the range of research and expertise
housed there. And if you’re in the neighborhood, stop by and witness
their wealth of outreach programs and hands-on activities. You might catch
some kids collecting oysters or a lab assistant analyzing water for heavy
metals. I found the spot beautiful and fascinating. The area’s rich
history, dating back to the War of 1812, makes it a great stop on any
family vacation.
scripps100.ucsd.edu
Scripps Institution of Oceanography has recently kicked off its centennial
year by launching a new Web site to celebrate 100 years of earth science
research. Founded in San Diego, Calif., in 1903, Scripps was the first
multidisciplinary oceanographic institution in the United States. The
centennial Web site offers a detailed history of the institution as well
as a calendar of celebration events, which culminate on Scripps’
anniversary on Sept. 26, 2003. History buffs will love the old photos
and stories that look back at the early days of modern oceanographic research.
www.coris.noaa.gov
The National Oceanic and Atmospheric Administration (NOAA) also recently
launched an oceanography Web site — a comprehensive source of information
on coral reefs. This new Coral Reef Information System (CoRIS) provides
access to 19,000 aerial photographs and hundreds of navigational charts,
as well as reports on coral reef monitoring and other related studies,
photographs and data. CoRIS is now the single point of access for coral
reef data from NOAA. It streamlines more than 50 NOAA coral reef Web sites,
offering easy access to a wide range of resources. CoRIS includes two
different methods of accessing data — a metadata search aimed for
the general user, and a spatial search aimed for the user who is familiar
with GIS applications and interested in a specific geographic area.
HawaiiOceanScience.org
In July, the State of Hawaii announced the launch of a new Web site
to highlight ocean science and technology advancements made by Hawaiian
scientists who work both within and outside of the state’s borders.
The Hawaii Ocean Science site features a unique trade magazine of articles
written by marine researchers on topics ranging from water quality and
ecology to geophysical surveying and minerals research. The site is also
a gateway to information about Hawaii ocean science industries —
featuring a list of 170 Hawaiian companies and access to their press releases.
Although the site primarily targets the media and investment communities,
it is also a great place for the curious minded to learn more about the
rapidly advancing field of ocean technology.
www.nhc.noaa.gov/index.shtml
This month marks the middle of the 2002 Atlantic hurricane season and
you can keep track of the latest developments in the air and seas at NOAA’s
National Hurricane Center (NHC) Web site. A list of all active tropical
systems opens on the site’s homepage. From there, you can link to
pages about how hurricanes form, the most recent forecasting models and
past hurricanes. You also can take a look at satellite and radar storm
imagery and sign up to receive NHC advisory e-mails.
www.nationalacademies.org/opus/elnino
This Web site, El Niño and La Niña, is produced by the National
Academy of Sciences Office on Public Understanding of Science and the
Academys Ocean Studies Board. It documents how decades of scientific
research have helped us understand the relationship between ocean and
atmosphere.
geollab.jmu.edu/vageol/index.html
The Geology of Virginia Web Source is run by James Madison University
and features an excellent and easily navigated study and review of the
Wilson Cycle, the cyclical opening and closing of ocean basins. The site
features pictures and descriptions of each stage of the cycle, along with
basic technical definitions and self quizzes.
Back to index
www.digimorph.org
In contrast to laboring over a fossil with a chisel and brush, some paleontologists
are using technology to easily view and study specimens without the risk
of damage. High-resolution scanners have provided 3-D images for hundreds
of fossils, rocks, meteorites and organisms from more than 80 universities
and natural history museums, all archived in a digital library, at the
“Digimorph” site.
But the site is not only for researchers. Anyone interested in scrolling
through the layers of a 98-million-year-old fossilized snake with legs
or a 20-million-year-old fossilized primate skull will enjoy browsing
the archive created by researchers at the University of Texas in Austin
about six years ago. The site has developed “a functionality I had
never dreamed of,” says Timothy Rowe, project director.
Start at the site’s homepage, which features the newest scanned specimens.
Clicking on the Aug. 8 addition of a “snake with legs,” for
example, leads to an abstract about the two known specimens of Pachyrhachis
problematicus. The page also describes how the X-ray computed tomography
scans, which provide a nondestructive way to digitally view in 3-D interiors
of solid objects with a resolution down to tens of microns in size, helped
researchers examine the resin-embedded snake skeleton and solve the debate
over the species’ lineage.
Return to the homepage and browse the library by scientific or common
names, as well as what’s new or popular. Extinct specimens are denoted
by a cross. Clicking on any specimen, such as the fossil primate Tremacebus
harringtoni, opens a page with an image and a description of the species
and specimen. Scans of this Early Miocene primate, collected from Argentina,
revealed that its olfactory ability was probably less sensitive compared
to other primates, which researchers say supports preexisting evidence
that T. harringtoni was not nocturnal. Scans also show where plaster
was used sometime after 1932 to reconstruct missing parts. Use the Java
slice viewer to peek inside the skull cavity of this Early Miocene primate.
Don’t leave this page, however, without clicking on “slice movies”
to watch the skull rotate on its axis.
Keep an eye on this site for future developments, such as a searchable
database like Google. Instead of searching by words, however, browsers
could search by shape to identify an unknown specimen.
www.jpinstitute.com/index.jsp
The Jurassic Park Institute Web site is owned and operated by Universal
Studios and Amblin Entertainment, which brought Michael Crichton’s
trilogy of dino-engineering stories to the big screen. The movie moguls
created the Web site to provide kids, parents, teachers and scientists
with “the ultimate resource” for learning about dinosaurs. The
site is a bit hokey but aims to present scientifically based information
in such a way that kids won’t necessarily realize they are learning.
The Dino Lab is especially fun, where you can learn and quiz yourself
about everything from dinosaur nesting habits to how to become a paleontologist
and what the job entails. The site has other entertaining games and activities,
a glossary of dinosaur terms kids might need to know (such as an explanation
of the Jurassic and geologic time), and stories about real-life paleontological
finds.
www.devoniantimes.org
The Devonian Times Web site explores a decade of paleontological research
on a Devonian-age fossil site in Pennsylvania. Philadelphia’s Academy
of Natural Sciences released the Devonian Times second edition site this
year to update and revise the information presented in the first edition,
launched in 1997. “The site presents many aspects of the flora, fauna,
paleo-ecology and geology of the Late Devonian, a critical interval in
the history of life and ecosystems on Earth,” says Ted Deaschler,
a vertebrate zoologist at the Academy of Natural Sciences. The Devonian
Times features some informative diagrams and pictures, as well as a wealth
of Web resources to the surfer looking for more information about a specific
aspect of the Devonian.
www.wku.edu/~smithch/biogeog
Biogeography explores the relationship between geography and the ecological
distribution of life — “what lives where, and why,” says
Charles H. Smith, science librarian for Western Kentucky University’s
Helm-Cravens Library. To advance the study of this field’s evolution,
Smith has opened a free Web site that contains a bibliography of works
on biogeography that were published before 1950. The online bibliography
has source links color-coded according to their availability. Links in
blue take the reader to an online copy of the article. Green links show
you source available through the JSTOR electronic journal archive. And
some links take you to biographies of the authors. Any student or teach
of biogeography will find this site a comprehensive resource for studying
the history of this field.
www.ucmp.berkeley.edu/help/timeform.html
Take a ride in the Geological Time Machine found on the University of
California at Berkeleys Museum of Paleontology Web site. The site features
a geologic time scale with extensive links to pages of information specific
to each time period. Search museum specimen catalogs for a specific
fossil, link to information on the tectonics and stratigraphy for almost
any time period or use the online glossary of natural history terms.
www.ZoomDinosaurs.com
Who named Tyrannosaurus rex? Did Brachiosaurus care for its young? This
site can help students find those answers. Sponsored by EnchantedLearning.com,
ZoomDinosaurs provides easy-to-access information on more than a hundred
different dinosaur species, as well as a dinosaur dictionary and other
resources to make gathering information for a dinosaur report easy for
young students.
www.acnatsci.org/leidy
This Web site about the man heralded as paleontologys founding father,
Joseph Leidy, has so much information on many of the advancements in all
areas of science during his lifetime that, whether or not youre interested
in paleontology, youll lose track of time visiting this site. Leidy,
born in 1820, made major scientific advances in the fields of paleontology,
parisitology, anatomy and natural history before he died in 1891. And
somehow, this site manages to include just about all you might want to
know in a way that is, surprisingly, not overwhelming. One of its highlights
is a short page on Leidys correspondence with Charles Darwin around the
time Darwin published On the Origin of Species. Excerpts from their letters
just after the release of Darwins famous text provide an interesting
glimpse into the spread of evolutionary theory through the world of science.
Each page is full of annotations that include background and additional
links to even more outside sources of information than anyone could ever
visit in one sitting. This site, authored by the Academy of Natural Science
of Philadelphia, gets a standing ovationshow it to your students, kids,
spouses and friends (provided that theyre as geeky as you).
www.priweb.org
The Paleontological Research Institute in Ithaca, N.Y., houses one of
the Northeasts largest invertebrate fossil collections. Its Web
site highlights these ancient organisms, as well as the Institutes plans
to exhibit such specimens in a state-of-the-art Museum of Earth adjacent
to PRIs current location. The site is an easy-to-use hub of information
on PRIs fossils, acquisition of a Northern right whale skeleton, field
trips, Museum of Earth plans and educational sites. Points of interest
include the Glacial Legacies download and an image database of invertebrate
fossils cleverly laid out in clickable drawers found by following the
Collections link. Glacial Legacies chronicles the glacial history
of New York in 59 text and image slides, detailing topics such as kettle
lakes, erratics and gravel pits. Touring the Collections gives
you access to limited, but well-described arthropod and echinoderm fossil
images. Another feature is the Mastodon Project page, which chronicles
PRIs excavation and study of the Gilbert and Hyde Park mastodons.
These pages include pictures of unearthed mastodon tusks and bones, their
assembled skeletons, and clips of media coverage of the events.
Back to index
www.scotese.com
Chris Scotese, a geologist at the University of Texas, Arlington, has
been working for several years on putting together the Paleomap Project
Web site, an interactive site where you can learn all about plate tectonic
movement and development over the last 1.1 billion years. Although the
site lacks some visual appeal, it is chock-full of information that is
otherwise somewhat difficult to find.
The site provides detailed maps of the world modeled for periods from
the Precambrian to the Cretaceous to 250 million years in the future.
The two largest segments of the site are “Climate History” and
“Earth History.” In both, you’ll get a listing of the periods
and maps of the world during that time period, which show the location
of continents and seas. For example, clicking on the Jurassic would take
you to a world where Pangea is just beginning to break apart. The climate
maps show lithologic indicators (such as rock types and fossil types found)
for climatic conditions. The maps are interesting to see and compare,
and there is also a link on each page to more information about that period.
An animation section allows you to see in motion just how the positions
of continents and climates changed over time, for example, how Pangea
broke apart.
It would take days to get through all the cool maps and animations, or
at least to study and compare them with a modicum of attention to detail.
Still, students, teachers, geologists and trivia buffs would benefit from
a tour around this site.
www.platetectonics.com
Searching for recent articles related to plate tectonics? In addition
to daily updates of geoscience articles from all kinds of news sources,
this Web site offers a searchable archive of news articles related to
plate tectonics, including continental drift, earthquakes, seafloor spreading,
volcanoes and evolution … a little something for everyone. The site
also offers an interesting browse-and-click map of ocean floors, including
information about the tectonics that guide the movement and growth of
the seafloor, and an online copy of Plate Tectonics: The Book, written
by Joe Giamportone, a former high school science teacher and owner of
the Web site.
www.sciencecourseware.com/eec/Earthquake
Do you want to become a virtual seismologist? Whether you are a student,
or someone who feels seismology-deprived, you will want to check out California
State University’s Virtual Courseware program, Earthquake. Funded
by NSF, Earthquake features virtual labs on using seismic waves to locate
an earthquake’s epicenter and to determine its Richter magnitude.
You will use maps and seismograms to record observations in a scientific
journal. At the end, you take a quiz and, if you successfully complete
it, you will receive a Certificate of Completion as a Virtual Seismologist.
The virtual experience is a fun and educational way to pass an afternoon.
www.es.ucsc.edu/~jsr/EART10/Trips/FT3/overview.html
The 1989 Loma Prieta Earthquake set off a wave of earthquake hazard mitigation
efforts across the United States, and this Web site illustrates why. It
offers viewers a virtual tour of the Santa Cruz and San Francisco regions
just after the quake. The site is one of several virtual tours that can
be linked to through the University of California at Santa Cruzs Department
of Earth Sciences Web site. The overview provides a brief introduction
to the region and devastation caused by the earthquake and offers several
links to information and photographs on regional tectonics, building damage,
sediment liquefaction, surface cracks and landslides. This site would
be great for an intro-geology (undergraduate or high school) student beginning
an investigation into the Loma Prieta quake, or any earthquake for that
matter. It presents diverse information in a simple and easy-to-digest
manner. But the lack of links to outside sources of information and references
makes it only a jumping-off point.
www2.nature.nps.gov/grd
Take a tour of one of our nations national parksor at least a virtual
onethrough the Park Geology section of the National Park Services Web
site. The tour section offers information on the geology of each park,
in addition to wildlife, visitor information and a photo gallery. Tours
are grouped according to geologic formation or history. A section on plate
tectonics provides links to parks grouped under subheadings that pertain
to North Americas tectonic history. For example, under Ocean-Continent
Subduction Zones, you will find Active Volcanic Arcs, Ancient Arcs, Low-Angle
Subduction Zones and Accretionary Wedges. Each subheading is followed
by a list of links to National Parks that fall within those geologic regions.
Attaching a known location to an abstract geologic concept makes this
Web site particularly useful. Its difficult to imagine what really happens
during low-angle subduction, but a familiar sight makes the concept seem
a bit more tangible. This Web site could be a useful classroom tool.
www.pbs.org/wgbh/aso/tryit/tectonics/intro.html
Want an interactive way to teach your students (or yourself) about plate
tectonics? Check out this PBS site offering an animated Shockwave
image that lets you virtually create sea-floor spreading, a transform
fault, and subduction and convergent zones, all with a move of your mouse.
A map below the image indicates where in the world these processes occur
today, and accompanying text describes the massive crustal deformation
you just made. By following the hyperlinks throughout the site,
learn about the history of plate tectonics ranging from Alfred Wegeners
continental drift theory to the discovery of the Mid-Ocean Ridge.
If you are still hungry for interactive fun, click on the You Try It
Menu to play with any one of the sites seven other activities.
www.savageearth.com
This is a site created along with a summer 1998 PBS television series
on natural disasters. It is divided into three sections: tsunamis, earthquakes
and volcanoes. Each section gives a brief overview followed by links to
specific event information and clips of disasters-in-actionQuicktime
is required. The site sometimes overdoses on verbal hype ("tsunamis: waves
of destruction") but makes up for it in the close-up pictures of erupting
volcanoes and earthquake damage and the informative earthquake maps and
diagrams of plate motions at work. Put your kid at the monitor and let
her loose.
www.pbs.org/wnet/savageearth/animations/index.html
Teaching an intro geology course in the fall? Want your kids to understand
what your talking about when you point out a normal fault in a road cut
on your next family vacation? Direct them to this page on the PBS Web
site. It has great animations of difficult-to-explain geologic phenomena
such as dip-slip faulting, plate subduction, secondary and primary wave
propagation and several longer animations with detailed explanations of
the geologic processes. The animations are part of PBS ((Savage Earth))
section of its Web site, which offers basic information on many different
geologic processes.
gldss7.cr.usgs.gov/neis/history/
Select a day of the year and this site tells you what major earthquakes
happened on that day. When I typed in my birthday, I got the New Madrid,
MO quake — a 7.9.
Back to index
Polar
nicl.usgs.gov
The National Ice Core Laboratory Web site offers visitors the basics of
how researchers collect and store ice cores — from the remote polar
regions to the ice core facilities in Denver. Photos, maps and diagrams
add a nice touch, although the accompanying explanations are not very
detailed. Still, the site provides a good overview and includes a complete,
printable inventory of all ice cores. And, if you are planning a trip
to Denver, check out the site to learn more about touring the lab, where
you can sample and analyze a core — a cool spot for any family vacation!
polar.nrcan.gc.ca
For a broader view of arctic research, visit Canada’s Polar Continental
Shelf Project (PCSP) Web site (see also the story on page 24). For more
than 40 years, PCSP has supported Canadian academic and governmental activities
in the Arctic, providing ground and air support services to hundreds of
scientific groups every year. The program’s site links to current
research activities, describes past work and provides general information
about working in the remote Arctic. Be sure to check out the “For
Kids” section, which features spectacular photographs and a fun quiz,
which perhaps will even challenge you adult surfers.
www.coolantarctica.com
The coolest aspects of this Web site devoted to all things Antarctic
are its photo gallery, its list of links to outside sites and its amusing
fact files. Here you can learn little-known tidbits about Antarctica,
like how the ancient Greeks first envisioned a cold Southern landmass
to balance out the northern one, “Arktos,” they already knew
about. And so, the landmass became “Ant-Arktos.” This site is
a great diversion for a winter’s day.
Regional Geology
www.avo.alaska.edu
Each day, about 20,000 people fly over Alaska’s Aleutian Islands
— the northern part of the “Ring of Fire,” which hosts
most of Alaska’s 100 volcanoes, or roughly 80 percent of all active
volcanoes in the United States, according to the Alaska Volcano Observatory
(AVO). And almost every year, one of those volcanoes has a major eruption,
threatening mostly air traffic, as the region is largely unpopulated.
AVO monitors volcanoes for such potentially hazardous eruptions, so that
you don’t have to. Still, you can stay “in the know” about
current volcanic activity by checking out the observatory’s Web site,
where you can learn about Alaska’s many volcanoes and see some close-up
photographs and archived Webcam images of spectacular eruptions.
First, check out the homepage, which features images of Alaska’s
currently “restless volcanoes.” To find out details about an
event, click on the name of a volcano or “full details on this episode
of unrest.” A page appears that brims with information, including
a map of the active volcano with respect to other Alaska volcanoes, cities
and towns, and links to daily and weekly status reports.
On Oct. 1, for example, the restless volcano list included Fourpeaked
Volcano. Clicking on the volcano’s name, browsers could see that
this volcano is located inland from the Aleutian Islands, near Cook Inlet,
and just south of Mount Douglas and perhaps the more familiar Augustine
Volcano. Clicking on that day’s status report, visitors to the site
learned that scientists collected gas samples during a period of good
weather, and that over the course of the week, a glacier showed signs
of erosion and “slumping” ice around thermal vents. Scientists
know little about the volcano’s past because of ice cover that complicates
attempts to study its composition, but it is thought to be able to produce
explosive eruptions with plumes up to 10 kilometers (33,000 feet) above
sea level.
The homepage and status report ranked the level of concern for Fourpeaked
Volcano’s as “yellow,” although finding out what the color
scheme represents can be tricky: At the top of the activity report page,
click on the “Volcano Activity Notifications” link and scroll
down the page. A description of the four-color warning scheme is geared
toward aviation safety, and ranges from green (no eruption) to red (eruption
imminent or under way, with significant ash in the atmosphere).
Lastly, be sure to check out the site’s live volcano cams. At the
toolbar at the top of the homepage, hover your mouse over “current
volcanic activity” and select “Webcams” from the list that
appears. The page displays views from nine live cameras at five different
volcanoes (three show various views of Augustine). On Sept. 7, AVO added
three new Webcams to the site to include Aktuan, Katmai and Peulik volcanoes.
You never know when you might catch some explosive action — a view
that, thanks to AVO, you are less likely to unexpectedly see from your
window seat during your next flight over the Aleutians.
nrmsc.usgs.gov/repeatphoto
You hear a lot about the effect of climate change on the environment,
but now a new U.S. Geological Survey (USGS) Web site allows you to see
it. The Repeat Photography Project site houses a photo collection that
documents how glaciers in Montana’s Glacier National Park have changed
over the past century.
Researchers at the USGS Northern Rocky Mountain Science Center created
the collection by pairing historic photos, obtained mostly from the park’s
archives, with more recent photos snapped at the same locations and during
the same season as the historic photos. The Ansel Adams-esque images reveal
a striking pattern: Most of the 17 photographed glaciers are markedly
smaller than they were in the past. Some, in fact, are only one-third
of their maximum size, as estimated from photos, records, maps and geologic
evidence. The photos also document other impacts of climate change, such
as changes in vegetation.
The project is ongoing and will eventually expand to include paired photos
of other glaciers, alpine meadows, treeline regions, avalanche paths and
panoramic views from fire lookout stations. Along with the images, the
researchers are recording the GPS coordinates of the recent photos’
locations so that more follow-up photos may be taken easily in the future.
The site’s photos are not copyrighted and are intended for distribution
for personal and educational use as long as they are credited — a
bonus for anyone interested in illustrating the effects of climate change.
europeangeoparks.org
If you are traveling to Athens this month for the Summer Olympics, take
a look at this Web site before you go. You might find a Geopark or two
that you can’t afford to miss. The Geoparks comprise 12 parks throughout
Europe that the European Geoparks Network set aside to preserve for their
geologic heritage (see Geotimes, June 2003). The parks include an asteroid
impact site in France, a series of caves in Northern Ireland and a volcanic/marine
interactions coastal zone in Spain. But if you’re headed to Athens,
the two to check out are the Lesbos Petrified Forest and the Psiloritis
Natural Park in Crete. Not only will you find enticing pictures and descriptions
of these fascinating sites, but you also are able to link to the locations’
Web sites to learn even more and plan your trip. Considering you’ll
already have come as far as Athens, what’s another short boat ride
to an amazing location?
The Geoparks Network Web site will give you lots of
information about visiting each of these geoparks, but be aware that much
of the site is in French, still awaiting translation.
www.geology.wisc.edu/~maher/air.html
It’s “Geology by Lightplane” on this photography site by
Louis Maher Jr., a professor at the University of Wisconsin. Tour through
36 years of aerial photographs, organized geographically by flight. Maher
has made his copyrighted photos available to the public for geological
education. View the photographs on the main site and then download detailed,
2000-pixel-wide JPEG versions from an FTP site. The pictures range from
views of the wave refraction off Lake Michigan’s shore to sights
of the windblown sands of the Great Sand Dunes National Monument, providing
an interesting birds-eye geological perspective.
www.cageo.com/afghan_geo.htm
The geology of Afghanistan consists of a succession of narrow, northeast-trending
terranes of continental fragments that range from Paleozoic to Tertiary
age. Computer Applications Geoscience (CAG) now offers an online look
at Afghanistans structurally complex geology. At the CAG site, you can
view and download a map that shows the geologic make-up of Afghanistan.
You also can link to an Afghanistan Map Collection at the University of
Texas and various news stories related to how geology is helping the United
States in its war against terrorism.
museum.gov.ns.ca/fgm
Canada’s Bay of Fundy, known as home of the world’s highest
tides, is also home to the Fundy Geological Museum. Their Web site is
frequently updated, easy to navigate and highlights dinosaur excavation
projects, as well as current exhibits at the museum.
www.terrafly.com
Developed by the U.S. Geological Survey and IBM, this site gives you a
birds-eye-view of the United States. Type in a street address or
choose a locale offered on the Web site and view your town or city as
though you were soaring overhead. You can zoom in and out, check your
latitude and longitude and change your flying direction. The Java applets
that run on this site make it somewhat slow to load and there is a noticeable
delay when you try to navigate. However, while sitting at your desk, its
the closest thing to flying.
www.wims.uwyo.edu
The Wyoming Oil and Gas Resource Mapper is a printable, GIS-style, interactive
map of Wyoming. The map includes the usual cities and roads, and also
irrigated agricultural land, golf courses, precious metal deposits, geothermal
energy, oil and gas wells, faults, bedrock geology, and limestone quarries.
Be warned though. The site is a bit unwieldy. The map takes about 30 seconds
to redraw itself between each modification, and some colors are hard to
see against the background. Still, if you've got a fast Internet connection,
a good monitor, and an interest in Wyoming, its a fun site.
www.oregongeology.com/
Whether youre an Oregonian or a New Yorker, youll appreciate this Web
site hosted by the Oregon Department of Geology and Mineral Industries.
Its home page boasts, Oregons spectacular scenery is a direct result
of awesome geologic forces acting on the land for millions of years.
In this same vein, the site highlights the states geological assets and
how to find them. Points of interest include the John Day Fossil Beds
National Monument, how and where to pan for gold, and how to recognize
a Thunderegg, Oregons official state rock.
geollab.jmu.edu/vageol/index.html
The Geology of Virginia Web Source is run by James Madison University
and features an excellent and easily navigated study and review of the
Wilson Cycle, the cyclical opening and closing of ocean basins. The site
features pictures and descriptions of each stage of the cycle, along with
basic technical definitions and self quizzes.
Back to index
Rocks/Minerals
www.uni-wuerzburg.de/mineralogie/links.html
Links for Mineralogists: The Institute of Mineralogy at the University
of Würzburg, Germany, provides useful links for mineralogists, petrologists
and crystallographers. The site offers large, color images of minerals
in thin section as well as mineral descriptions that could make it a good
teaching tool. Its many other features are journal and abstract search
engines, and links to an international collection of academic and private
sites on minerals and geology.
www.minerals.net/index.htm
When you dont remember the chemical formula for topaz, need the specific
gravity of opal, or want to look at some snazzy pictures during your lunch
hour, this Web site is the place go. The Mineral and Gemstone Kingdom
site is organized into subgroups that let you search minerals, gemstones
and images as well as an extensive glossary of terms from alloy to zeolite.
Not all minerals and gemstones are catalogued, but its list is growing.
The sites resources page describes the basics of mineralogy and information
on collecting and buying gemstones, while its links, though not all current,
take the novice or seasoned hobbyist to other gem and fossil collections.
Back to index
Google is once again illuminating the night sky. The company that brought us the interactive Web sites Google Moon and Google Mars now brings us a heavenly counterpart to its popular Google Earth: Google Sky. It’s included when you download the new Google Earth 4.2 (earth.google.com).
Google Sky is essentially a planetarium. To enter, first open Google Earth. From there, switch to Google Sky by clicking on its icon in the toolbar across the top of the screen. It will transport you to the portion of the sky that’s visible from wherever you were in Google Earth. This is a nice feature for those in the Northern Hemisphere who might never see the sky over the Southern Hemisphere and vice versa.
If you’re familiar with Google Earth, navigating Google Sky will be easy as the controls are identical. And like Google Earth, you can travel directly to different portions of the sky by entering names of stars, constellations, galaxies or other celestial bodies into the search box in the column on the left side of the screen.
You can also learn about the different objects you see during your explorations by turning on Google Sky’s different layering features, which are listed at the bottom of the column on the left side of the screen. Clicking on “Constellations” will label and connect the constellations. The visually pleasing “Hubble Showcase” will identify all of the objects in space photographed by the Hubble Space Telescope. By clicking on one of these objects, a window pops up that includes a photograph, background information and a link to Hubble’s Web site.
The layers most beneficial to those new to astronomy are “Backyard Astronomy,” “User’s Guide to Galaxies” and “Life of a Star.” “Backyard Astronomy” labels all of the space objects that we can see from Earth with nothing more than our eyes or an amateur’s telescope. Like the Hubble feature, clicking on one of these objects brings up a window that provides basic identification information and, when available, an image and a link to a Wikipedia article.
“User’s Guide to Galaxies” labels different types of galaxies and “Life of a Star” indicates stars that represent different stages in a star’s lifecycle. By clicking on these objects, you’ll learn more about the specific galaxy or star, as well as general information about the type of galaxy or stage in a star’s life.
These layers are all informative, but using them all together crowds the sky with too many different names and symbols. Try using only a few at a time.
Although Google Sky isn’t the only digital planetarium out there (see below), it’s a fun, useful tool that offers something for everyone — whether you’re an astronomy novice or astrophysics professor.
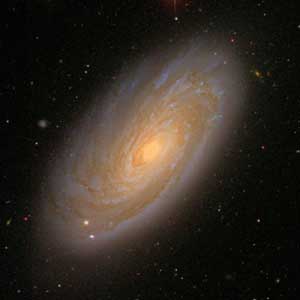 SDSS |
| Is this a spiral or an elliptical galaxy? At the new Web site Galaxy Zoo, anyone can help scientists classify galaxies. (This is a spiral galaxy.) |
Astronomy enthusiasts, take note. Oxford University researchers need your help classifying galaxies. Instead of using your trusty telescope, however, the only tool you’ll need is a computer with Internet access. And you might want a comfy chair, because once you start classifying galaxies and exploring never-before-seen images of our universe at the researchers’ new Web site Galaxy Zoo (www.galaxyzoo.org), you might not want to stop.
Galaxy Zoo allows anyone — whether you fancy yourself an amateur astronomer or have never even peered through a telescope — to participate in real scientific research. With the goal of having their Web site’s users categorize a million galaxies, the creators of Galaxy Zoo hope to learn more about the abundance and distribution of different galaxies in our universe and gain a better understanding of galaxy formation and evolution.
Galaxies are collections of stars, gas and dust held together by gravity, and they come in two main varieties: elliptical and spiral. From a distance, elliptical galaxies look like fuzzy balls of light that are brightest at their centers, becoming dimmer at their margins. Spiral galaxies, such as our Milky Way, look like hurricanes in space with a central mass of light from which long, cloudy, curved arms emanate.
During your first trip to the Galaxy Zoo, create a username and password before proceeding to the Galaxy Tutorial. There, novices learn the basics of galaxy classification: how to distinguish a spiral galaxy from an elliptical one, how to spot two merging galaxies and how to differentiate a clockwise spiral galaxy from a counterclockwise one. After practicing their classification skills, first-time users need to pass the tutorial’s quiz, correctly identifying at least eight out of 15 galaxies, before they can begin to participate in the project. After earning their credentials, participants are free to spend as much time as they like classifying galaxies.
On the Galaxy Analysis page, users will find an unclassified image with all of the classification options lined up next to it. After the user chooses a category, a new image will pop up automatically. The Web site keeps track of all of the galaxies a user classifies, so that he or she can review them again anytime. (It is also a safeguard for the Web site’s creators to be able to check the accuracy of classifications.) Galaxy Zoo’s online forum offers users a place to get help with especially tricky galaxies, share unusual or impressive images they’ve come across or just chat about anything related to astronomy.
In part, the idea for Galaxy Zoo was “born out of my own desperation because I used to do this all by myself,” says Kevin Schawinski, an Oxford graduate student in astrophysics and one of Galaxy Zoo’s creators. For his own research, Schawinski spent a week combing through images from space, classifying a total of 50,000 galaxies. Pleased with the results from this modest sample (the universe is thought to be home to billions of galaxies), he and one of his colleagues at Oxford, astrophysicist Chris Lintott, imagined what they might learn given the opportunity to study a much larger sample of galaxies that covered a larger portion of the universe, Schawinski says.
Access to such a large sample was not a problem. Schawinski and Lintott could use hundreds of thousands of publicly released images from the ongoing Sloan Digital Sky Survey, the world’s largest astronomical survey that is mapping more than a quarter of the sky using a telescope and digital camera based in Apache Point, N.M. Analyzing the images, however, would be a formidable task that would be too time-consuming for one person, or even a few people. And this is one area of astronomy where computers are of little help. “You can try to write an algorithm to try to classify galaxies, but [the computer] can be easily deceived,” Schawinski says.
Humans, in contrast, are “just fantastically good at this” sort of thing, Schawinski says, and “you don’t need to be an expert in astronomy.” Putting a catalog of images online for people to classify from the comfort of their own home seemed like the best way to attract volunteers. Schawinski and Lintott had already seen the concept work for University of California at Berkeley astronomers who created Stardust@home (stardustathome.ssl.berkeley.edu), a Web site where people search through magnified images of material collected by NASA’s Stardust spacecraft to identify individual grains of microscopic interstellar dust.
The gates of the Galaxy Zoo opened July 11, and the response was overwhelming, Schawinski says. In its first few weeks, Galaxy Zoo already had more than 70,000 registered users. These users have already classified a million galaxies. To ensure accuracy, Schawinski and Lintott would like each galaxy to be classified by multiple users, so there is still plenty of work left to do.
As of Aug. 1, Galaxy Zoo’s top classifier, 17-year-old Chris Stevens of Toronto, Canada, had classified more than 50,000 galaxies. “I have spent a fair bit of time classifying, because of all the free time I have since I don’t have a job,” Stevens says, estimating that he spends nearly four or five hours a day classifying galaxies. As a student, he enjoys the opportunity to participate in scientific research “instead of just reading about it,” he says. The project has also reinforced his desire to further his education in astrophysics. A fascination with astronomy also motivated Christopher E. Lorr, a staff sergeant in the U.S. Air Force, to take part in Galaxy Zoo. Lorr, who one day hopes to be an astronaut, has classified hundreds of galaxies. “I spend about 20 to 40 minutes every other day on the site,” he says. A nice benefit of classifying galaxies, he says, is “you get to see some amazing images that few people have ever seen.”
With the success of Galaxy Zoo, Schawinski says its infrastructure could be used in other astronomical projects, especially given the large number of people who seem willing to devote so much of their time to such projects. “I do this because I want to graduate and get a Ph.D.,” Schawinski says. “These people do it because they are fascinated by the universe.”
| Celestial objects march across a digital night sky in the free downloadable software Stellarium. |
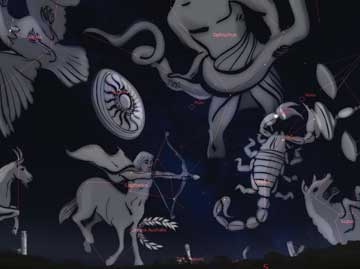
With Stellarium, a free, downloadable digital planetarium, you won’t just be seeing stars. You’ll see a star-filled sky in real time — just as it might look right outside your own window.
One of Stellarium’s most appealing twists on the classic planetarium is that its skies are photo-realistic, with twinkling stars and shooting stars, and the views are in real time. After opening the program on your computer, you see a view of the sky as it currently appears over a grassy landscape (whether daytime or nighttime), and it slowly rotates as time passes. The point of view is set to a default location (Paris), but users can enter different latitude and longitude coordinates, or choose a city from a number of pre-set cities to check on how the night sky is shaping up in London or Timbuktu. The time of day and even the speed of time are also subject to change, if you’re curious about which stars will be out tonight, or want to watch them sweep across the sky a bit more quickly. There are also several options for resetting the background landscape, including grassy fields, an ocean and the moon.
Be warned: Navigating your way around Stellarium can require a bit more than a sextant (a tool that sailors once used to help chart a course by the stars) or GPS. Several toolbars on the screen help you with some of the more sophisticated features, but basic zooming in and out on a particular star or planet requires knowing which keys control which function. The help button on the lower left toolbar contains a menu of these key functions.
Once you learn the control keys and have set your location, you can also begin to master the rest of the left-hand toolbar, which toggles some of Stellarium’s fun effects. Not only can you view the geometric connect-the-dots of constellations, but you can add an overlay of an artistic rendering of those constellations, find nebulae or superimpose projections of map grid lines on the sky. You can even add a little fog, for realism. The search function, also accessible from the left-hand toolbar, has an autofill feature that can be quite helpful with tricky star names. Once you type in the object you want to view, you are whirled around to it (sometimes those objects are not yet visible in the sky at the current time of day, so you may find yourself staring at the ground, or what’s below the horizon). You can also reset the “sky culture,” alternating the names of constellations between Greek, Inuit or Chinese, for example. On the lower right corner of the screen, another toolbar lets you change the speed of time, moving ahead into the future or backwards to the past to view how the stars were aligned on an important day.
Stellarium has a built-in catalog of more than 600,000 stars, and extra catalogs of more than 210 million stars are also available from the Web site as a separate download. In addition, the program includes a realistic Milky Way, the planets and their satellites and even other solar system objects such as the dwarf planet Ceres and asteroid Juno. (Eris was not included at the time of printing.)
To download Stellarium, visit www.stellarium.org (not to be confused with www.stellarium.com, an unrelated site that offers custom-built planetariums for museums). For more in-depth help with navigating, you can also download a User’s Guide (a PDF file) by following links on the site. Created by research engineer Fabien Chéreau and his team, the latest version of the program (released June 6) is available for Windows, Mac OS X or Linux. For computer-savvy users who want to tinker or add a favorite feature, the program uses OpenGL, an open source code that allows users to adapt it to add new objects, improve features or circumvent bugs, and is hosted at SourceForge, a software development site that hosts open source software projects.
As for the standard user, whether a kid working on a school project or an amateur astronomer wondering what that bright spot above the horizon is, the program is a fun, informative ride across the universe.
home.comcast.net/~eliws/ceres/
The Web site Ceres: The dwarf planet, out of the shadows gives
a crash course on the new dwarf planet, offering a collection of information
so you can “be as informed about Ceres as any professional,”
according to the site. It begins with a section titled “Why should
you care about Ceres?” The answer, according to the site, lies in
the possibility of a large supply of subsurface freshwater — a necessary
resource for life and space travel.
The rest of the site mostly offers images of Ceres captured over the years
through various telescopes. A few artists’ conception images are
also available: One shows how the authors of a Sept. 8, 2005, paper in Nature envision the interior of Ceres, with three main layers that
include an outer crust over a layer of water-ice, which in turn envelopes
a rocky inner core. A second depiction compares the size of Ceres relative
to other solar system objects, such as moons and planets.
Finally, the site suggests that the door is open for other asteroids near
Ceres to join the ranks of dwarf planet, if they are found to be round.
If you finish browsing this site and crave more Ceres, check out the numerous
links to various resources, including research papers, historical accounts
and more pictures.
dawn.jpl.nasa.gov/DawnCommunity
NASA’s “on-again, off-again” DAWN mission is currently
on and scheduled to launch a probe to Ceres in June. It will be another
eight years after launch, however, before the probe falls into orbit around
Ceres. Still, NASA’s DAWN Web site is worth browsing to learn more
about what scientists will be looking for during the first-ever visit
to a dwarf planet.
The site’s main feature is a timeline related to the DAWN mission.
Click on the timeline to engage the interactive version, and watch as
an animated probe makes its way from Earth, slingshots around Mars, and
orbits the asteroid Vesta before heading to Ceres. The entire mission
unfolds in about a minute, which in real-time will take about 15 years.
Next, scroll over the timeline at the bottom of the animation. Start at
the year 1530, when Copernicus first suggested that Earth is not the center
of the universe. Scroll over the subsequent dates from the next few centuries
to learn about the discovery of Ceres and Vesta. The timeline ends in
2015, with links to a page describing the mission’s current status.
Return to the homepage to explore the site’s other features. Kids
might enjoy the “DAWN Kids” link, from which you can download
coloring sheets and the paper components necessary to construct a spacecraft
model. Kids and adults alike might also find useful the site’s 3-D
visualization tool, which demonstrates how the orbits of Ceres and Vesta
relate to other solar system bodies. Simply select any date and push play
to watch the planets, dwarf planets and asteroids revolve in their orbits
around the sun.
www.lpl.arizona.edu/DISR/Multimedia/Titan_Movies.htm
In January 2005, the Huygens probe took 147 minutes to descend through
the thick, orange atmosphere of Titan, Saturn’s largest moon. Now,
from the comfort of your desk, you can take that plunge in less than five
minutes and see what the probe saw as it fell to the surface of the unexplored
moon.
The view comes via new movies released May 4 by NASA, the European Space
Agency and the University of Arizona. Erich Karkoschka, an astronomer
at the University of Arizona in Tucson, and colleagues compiled data from
a camera and other instruments aboard the Huygens probe, and spent about
one month creating each of the four movie versions — three intended
for lay audiences and one for scientists.
“It was a lot of work, but also a good way to show everyone how it
happened,” says Karkoschka, who animated the movies.
The first video, titled “A high-resolution movie of the Huygens descent
with narration,” is the best option for nonscientists, Karkoschka
says. Click on the title to download the large 156 megabyte file. Smaller
files can be viewed at the NASA/JPL
Cassini-Huygens Web site (search the multimedia section), but the
larger file’s crisp resolution, which fills your entire computer
screen, makes the extra download time worthwhile, he says.
The scene begins with a distant view of Titan, shrouded in orange-brown
clouds. David Harrington, a radio announcer at a southern Arizona classical
radio station, narrates the probe’s dynamics, such as descent speed,
and describes the unfolding scene as the probe moves toward the moon at
6 kilometers per second (about 1,340 miles per hour). Parachutes open,
Harrington says, slowing your approach.
At the center of your screen, the haze begins to lift, revealing the first
views of Titan’s valleys, hills and a system of dunes (see story,
July 2006). Drainage channels, likely caused by runoff from methane
rain, come into focus at about 25 kilometers from the surface. Harrington
warns viewers to “hang on” as Huygens slows to 17 kilometers
per hour and lands “softly” in a dry basin near a water-ice
outcropping.
The landing replays from an altitude of 31 kilometers. This time, however,
the view looks west, and after landing, zooms in on some nearby methane-ice
rocks and pebbles. If you prefer a quieter landing, watch the second movie,
which is essentially the same as the first minus the narration. To experience
a more dramatic version, watch the third movie, which is accompanied by
Beethoven’s Piano Concerto No. 4 in G major.
Scientists will most enjoy the fourth film, which is more technical, Karkoschka
says. Reminiscent of a video game from the early 1980s, the screen brings
scientific data to life: An animated parachute in the upper left corner
reenacts its actual movement over time, and different tones and clicks
indicate changes to the probe’s rotational speed, heat shielding
and signal strength.
Whichever version you select to watch, you are bound to learn something
new about Huygens’ descent and the geology of Titan’s surface.
The movies particularly excel at showing Titan on a grand scale, from
the whole moon down to its tiny pebbles.
mars.google.com
“Moon, Mars and beyond” is now more than just President Bush’s
vision for space exploration; Google also made the jump from the moon
to Mars on March 13, when the company launched its latest interactive
image Web site.
The company began with Google Earth, which combines satellite images with
other data into extensive 3-D presentations. Browsers can navigate Earth
and view the details of everything from the Grand Canyon and hurricane
damage to a local restaurant (see Geotimes, December 2005). Next, Google
created interactive maps of the moon that allowed browsers to explore
a lunar landing site or to peek inside an ancient crater. Visit Google’s
latest addition, however, for a close look at Mars.
The Google Mars homepage starts out with a colorful image of the planet’s
surface elevations that looks anything but red. Elevation differences
range from 9 kilometers below the planet’s average surface level
(depicted by black) to 21 kilometers above average (depicted by white),
but every crater and trench that falls between those elevations spans
the rainbow.
Use the navigational tool in the upper left corner to scroll around a
seamless melding of 17,000 individual photos obtained by NASA’s Mars
Odyssey spacecraft, which has been orbiting the planet for about five
years. Also, use that same tool to zoom in on details of features down
to 230 meters across, about the size of 2.5 football fields.
If you want help finding the most interesting surface features, look to
the top of the page for lists of mountains, canyons, dunes, plains, ridges
and craters. Click on any of the 118 alphabetized mountains, such as Olympus
Mons, which the elevation scale depicts as mostly white, as this volcano,
the tallest known in the solar system, stands about 27 kilometers high
— about three times the height of Earth’s tallest mountain,
Mount Everest.
After you choose a feature to explore, markers appear on the image with
text boxes that provide information about the size and history of the
object. Links lead to an Arizona State University Web site that describes
the object’s geology in greater detail, and provides additional imagery
and statistical information.
And if you have ever wondered what it would be like to fly through a canyon
on Mars that is as deep as Mount Everest is high, download “Flight
Into Mariner Valley” from Google video at: video.google.com/videoplay?docid=-1622667251598627943.
About 10 times as long, five times as deep and 20 times as wide as Earth’s
Grand Canyon, it is difficult not to feel small (or sick) while maneuvering
around the winding branches of Mariner Valley.
A team at Arizona State University compiled more than 500 images of the
canyon obtained from NASA’s orbiting Mars Odyssey spacecraft. NASA’s
Jet Propulsion Laboratory’s Digital Image Animation Laboratory then
used those images to create this detailed virtual airplane tour.
As a bonus, the movie’s narration describes how different features
within the canyon might have formed. For example, while cruising alongside
a valley wall, you learn that such cliffs likely began to form billions
of years ago as a result of earthquake faulting. Another side of the canyon
possibly formed as groundwater led the ground surface to collapse in on
itself. Keep in mind, however, that planetary geologists are still finding
out details about Mars’ land and water processes, and current ideas
could one day be revised.
www.slackerastronomy.org
What began as a fun project for a group of professional astronomers and
journalists quickly grew, and more than two years later, the Slacker Astronomy
podcast has 12,000 weekly listeners tuning in for the latest news in astronomy.
But this is not your dry college lecture from a textbook; instead, the
show's hosts are entertaining and informative, or as they say, “heavy
on the cheese, heavy on the science.” You can sign up for this show
through Apple’s iTunes or download it directly from the Slacker Astronomy
Web site. The Web site’s main page lists the most recent shows in
the center, and archived shows appear in categories listed on the right.
The site’s producers also list their blogs from society meetings,
as well as their favorite external blogs and podcasts.
www.spaceweather.com
Typical weather reports may suggest whether to grab an umbrella or sunglasses
as you head out the door. But to remain informed about weather generated
beyond Earth’s atmosphere, browse www.spaceweather.com, a popular
and easy-to-use Web site that organizes noteworthy information within
a single page.
A column on the left of the homepage keeps readers updated with the current
weather conditions in space. Included are data such as current solar wind
speed and density, sunspot numbers and the maximum solar flare expected
within six and 24 hours. Browsers can click on a link for additional data
from the National Oceanic and Atmospheric Administration, or another link
for a detailed explanation of a phenomenon as well as how it affects Earth.
Look center of the homepage for the “What’s Up in Space”
column, updated daily. The column features timely coverage of space events
such as the intensity of the latest meteor storm or the expected visibility
of the aurora. You can also sign up and pay to have the “Spaceweather
Phone” alert you of these and other events or have similar information
sent to your inbox free of charge.
To help site visitors locate further detail about space weather topics,
the bottom of the homepage provides an exhaustive list of related links.
Also, search the archives to view space weather on any date back to the
year 2000.
salmon.nict.go.jp/awc/contents/index_e.php
Charged particles from the sun can interact with Earth’s atmosphere
any time of the year to produce twisting ribbons of green and red light
over Alaska in a phenomenon known as the aurora borealis, or the “northern
lights.” But one of the best months to catch a show is October —
when hours of darkness return to Alaskan nights, yet before clouds from
winter storms dominate the sky. Now, observers don’t have to travel
to Alaska to view the spectacle; they can watch the show online via the
Aurora Live webcam.
The National Institute of Information and Communications Technology (NICT)
of Japan houses the camera in Chatanika, Alaska, about 30 miles north
of Fairbanks. Auroral activity is captured on a fisheye lens and relayed
live to the site’s homepage. Other noteworthy features of the main
page include observation information such as the current Alaskan time,
the best daily observation time and the duration of night hours. And don’t
pass by the “selections” section, which lists the best archived
shots that captured anything from extraordinary auroras and clouds luminous
at night, to forest fires and wild animals.
If you want to know what the aurora looked like Jan. 17, 2005, for example,
then search the complete list of images and videos under the “image
archives” button. A monthly calendar will appear that ranks auroral
activity for each date as none, faint, moderate, excellent or remarkable.
The January event was one of the few ranked “remarkable” so
far this year. The only difficulty with this section is that, unless you
can understand Japanese, archived data before the year 2005 remains unreadable.
www.gemini.edu/images
If you’ve ever wanted to see some pretty amazing photographs of outer
space, Gemini is the Web site for you. A partnership between seven countries
and several agencies, Gemini is the Web site of the Gemini Observatory,
which is a network of high-powered telescopes at two locations —
at Hilo in Hawaii and atop Cerro Pachón in the Chilean Andes. Although
this Web site that explores the skies itself is not new, the online photo
gallery is new this year. You can see pictures of stars forming, planets
and their moons in infrared, and entire galaxies. With every picture is
a lengthy explanation of what you’re seeing, which is nice because
most of the time, it’s not readily clear. You can also download posters
and “wallpaper” for your computer.
www.marsquestonline.org
If you’ve ever wanted to launch a spacecraft to Mars, see the red
planet’s volcanoes in 3-D or drive a NASA Mars Rover, try this new
Mars exploration Web site. Mars Quest Online, hosted by the Space Science
Institute, NASA and TERC (a nonprofit education research and development
organization), is divided into two primary sections: Explore Mars and
Mars Mysteries. One click on either section and you’re whisked away
on a fascinating tour of the planet’s landscape, filled with fun
facts and remarkable pictures. Although designed as an education resource
for kids, the site is friendly and highly interactive for explorers of
all ages. I particularly enjoyed the “How Big” interactive quiz,
where you see a geological feature on the martian landscape, and then
superimpose an object on top to get a feeling for the feature’s size:
I superimposed a school bus, a football stadium and the entire United
States on both a single martian canyon and a volcano!
athena.cornell.edu
Get your update on the latest mission to Mars on this fun and informative
Web site operated by the Cornell/Athena science team. Athena is the name
of the suite of instruments on the Mars Rovers set to launch next month.
Here you will find weekly news reports about the mission, neat trivia
about the rovers and Mars, a wealth of resources for kids and educators,
and a large gallery of rover photographs. Also featured on the Athena
site is a video simulation of the Mars Exploration Rovers mission: from
launch and cruise through space, to the entry, descent and landing on
Mars, and on through the rovers’ exploration of the Red Planet. The
video feels and looks real, or at least as you would imagine it —
inspiring you to read up even more on the mission and the future of scientific
exploration on Mars.
www.kidscosmos.org/field-trip-to-mars.html
After you tour through the Mars rover mission, take a tour of Mars on
Earth! At the Kid’s Cosmos site, kids and adults alike can “buckle
up and blast off to Mars.” The site features two tours, one specifically
for kids and another, more in-depth trip. Both virtual tours seek to teach
visitors about the geology of both Earth and Mars by comparing geologic
features in Washington State to those on the Martian surface — volcanoes,
dust devils, sand dunes, canyons …you name it! The tours come complete
with trip mileage along Washington highways, a map of Mars and some lovely
photographs that highlight both the unique and the comparative formations
on each planet.
impact.arc.nasa.gov
In the past several months, two asteroids barely missed striking Earth.
On June 15, the Near Earth Asteroid (NEA) 2002 MN passed Earth at a distance
of only 120,000 kilometers in one of the closest asteroid flybys on record.
In March, another asteroid, NEA 2002 EM7, passed within 463,000 kilometers.
Researchers did not detect either asteroid until days after their close
flybys. And in July, NASA researchers announced that a small NEA currently
under investigation, 2002 NT7, has a very small chance of striking Earth
in 2019.
NASA’s Asteroid and Comet Impact Hazards Web site covers near-miss
events in detail and provides a complete resource for information on objects,
such as 2002 NT7, that could potentially crash down to Earth. The site
features a news archive, background information on so-called Near Earth
Objects, and a gallery of images and animated movies. Also be sure to
check out the Torino Scale — the Richter Scale for categorizing the
Earth impact hazard associated with newly discovered asteroids and comets.
www.csr.utexas.edu/grace/
On March 18, NASA and the German Space Agency launched two satellites
into orbit on a five-year mission to study Earth’s gravitational
field. Called GRACE for Gravity Recovery and Climate Experiment, the mission
launched from the Plesetsk Cosmodrome in northwest Russia. GRACE will
map variations in Earth’s gravitational field over time. The twin
satellites will orbit Earth 16 times a day, travelling in tandem about
220 kilometers apart. The science data collected from the GRACE mission
will allow researchers on the ground to create a composite map of the
gravity field. This map will aid scientists in making digital terrain
models and in studying climate change.
The GRACE Web site provides a good overview of the project and of the
science and instrumentation behind it. The site also keeps its visitors
up-to-date on the latest developments as GRACE orbits Earth.
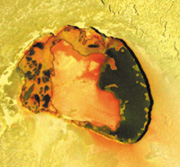 www.jpl.nasa.gov/images/io
Tupan Patera is an active hot spot on Io, named after a Brazilian thunder
god. Earlier Galileo views were unable to show details of Tupans volcanic
activity. This image, taken in October 2001 at a resolution of 135 meters
per picture element, shows the more complex nature of the 75-kilometer-wide
Tupan. A diffuse red deposit, perhaps condensed from sulfur gas escaping
from volcanic vents, coats much of the area. A pattern of dark black,
green, red and yellow materials covers Tupans floor. The black material
is recent, still-warm lava. Galileo scientists presume the yellow is a
mix of sulfurous compounds, and the green appears to form where red sulfur
has interacted with the dark lavas. You can read more about Tupan at the
NASA site, where you can also view and download the latest images from
NASAs Galileo spacecraft.
mars.jpl.nasa.gov/odyssey
On Oct. 23, NASA’s 2002 Mars Odyssey fired its main engine and launched
itself into orbit around the Red Planet. The 1,600-pound spacecraft hosts
a neutron spectrometer, a thermal-emission imaging system, a high-energy
neutron detector and a radiation monitor — all designed to learn
about the mineralogy, chemistry and hydrology on Mars. On the Mars Odyssey
Web site, you can follow Odyssey’s orbital path and scientific investigations,
and check out the latest images of the planet. Also visit www.geotimes.org
for the latest news stories on the mission.
photojournal.jpl.nasa.gov
NASA, the Solar System Visualization Project and the Jet Propulsion Laboratory
developed this Web site as a Planetary Photojournal. The site gives the
public access to more than 2,000 images from various Solar System exploration
programs. Choose a planet, pick a spacecraft or mission such as Galileo
or Voyager that photographed it, and submit your query. A search for Saturns
satellite Tethys returned seven images taken by Voyager 2. These can conveniently
be enlarged and downloaded in a variety of formats. Text that accompanies
each image describes the history of the planet or Moon youve selected.
www.jpl.nasa.gov/radar/sircxsar
NASAs Jet Propulsion Laboratory processes and posts radar images taken
during shuttle missions. Their online photo gallery features images
of cities, oceans, rivers, glaciers, volcanoes and other geological features.
Images are archived and searchable by category.
impact.arc.nasa.gov/index.html
The Asteroid Comet Impact Hazards Web site is produced by the Ames Space
Science Division of NASA and provides information about asteroids and
comets for the general public. The site includes information on Congressional
actions related to hazard mitigation, NASA programs, an image and animation
gallery and an archive of news stories about impact hazards.
near.jhuapl.edu/NEAR/iod/archive.html
The NEAR Image of the Day Web site offers just thatthe most up-to-date
images taken from the NEAR satellite. The Johns Hopkins University Applied
Physics Laboratory has posted a new image almost every day this year and
there are even a few from 1999 and 1998.
neo.jpl.nasa.gov/
This Web site, hosted by the Jet Propulsion Laboratory in Pasadena, Calif.,
tracks the location of "Near-Earth Objects" — comets and asteroids
that may graze our atmosphere, but don't hit us. In fact, Near-Earth Objects
(NEOs) are any objects detected within about 28 million miles of Earth's
orbit. The site explains NEOs, small NEOs, gives an updated list of recent
"near" misses and provides answers to frequently asked questions like,
"What Are Atens, Apollos and Amors?" Also, click on "Orbits" to check
your favorite asteroid's trajectory near Earth and other planets.
Back to index
Water
capp.water.usgs.gov/aquiferBasics
In case this month’s Geotimes coverage of groundwater and
aquifers has left you wanting more, check out the U.S. Geological Survey’s
(USGS) aquifer basics Web site. Not only will the site provide you with
excellent definitions and information (including detailed illustrations)
about various types of aquifers, but it also provides a list of, and links
to further information about, important aquifers in the United States.
The site also links to other USGS water sites, such as the groundwater
information site and the water resources page.
www.epa.gov/OW/index.html
No matter where you live, the Environmental Protection Agency’s (EPA)
water Web site will provide you with answers to commonly asked questions
about your water. Whether you want to know what contaminants may be lurking
in your municipality’s water, information on conservation measures,
or whether or not shellfish from your beach is safe to eat, this site
has answers. And should you have more questions, the site also provides
local and federal contacts.
Also look to the site to learn about broader environmental issues, such
as the health of the nation’s oceans, estuaries, lakes and wetlands,
as well as wastewater management. For kids, check out a special section
on drinking water that includes games, quizzes, water experiments and
educational activities.
groundwaterwatch.usgs.gov
The U.S. Geological Survey monitors the effects of droughts and other
climate changes on groundwater levels through a national network of about
150 wells. The Ground Water Climate Response Network Web pages provide
periodic data from all those wells, and continuous or real-time data from
selected wells. The Network integrates maps, groundwater hydrographs and
information from the National Water Information System (NWISWeb). Just
click on the map on the homepage to look at data for your local well.
Additional well data from each state is available from NWISWeb,
which contains data from about 800,000 wells across the United States
and Puerto Rico.
vcourseware5.calstatela.edu/VirtualRiver/Flooding/
A great activity for kids, this Web site, supported by the National
Science Foundation, highlights river flooding, sediment deposition and
erosion. It presents a variety of lessons, including an interactive flood
plain image, quizzes on river processes and an image you click to measure
the area of a watershed. According to the site, most students can complete
this virtual lab in about an hour.
water.usgs.gov/nawqa/data
The National Water-Quality Assessment (NAWQA) Program has launched a new
Web site that provides public access to USGS water-quality data collected
across the United States. In 1991, NAWQA began collecting water quality
information on 60 river basins and aquifers across the country that comprise
60 to 70 percent of the total water use in the United States. Nutrient
and pesticide levels have been a primary concern for the NAWQA program
and the data available on the Web includes about 15,000 pesticide and
volatile organic compound samples, as well as 26,000 nutrient samples
collected from the water column. Trace elements and organic compounds
were collected from sediment and animal tissue. Daily streamflow and temperature
data are available, as well as chemical concentrations in water, sediment
and aquatic organisms. Users can customize their search by choosing a
particular geographic area, including a state, group of states, counties,
basins or NAWQA study units, to then search for a particular chemical
of interest that might, for example, exceed water-quality standards.
Data can be exported to an Excel document or in several other formats.
water.usgs.gov/nwis
Last month the United States Geological Survey launched the National Water
Information System (NWISWeb), a site containing 100 years of archival
and real-time streamflow data. The USGS has been providing water data
on the Web for several years, but the new system is meant to improve information
transfer and help users integrate it with other data: historical and real-time
water-quality, groundwater levels and precipitation.
At 1.5 million surface-water and groundwater sites ranging from wells
to rivers, the USGS maintains instruments that continuously record physical
and chemical characteristics including water level, flow, pH, temperature
and dissolved oxygen. Uses for this information include forecasting floods
and droughts; flood control; evaluation of water quality and supplies;
monitoring the possibility of hydroelectric power; and safely fishing,
canoeing or kayaking.
You will have better luck with NWISWeb when looking for particular information
instead of casually surfing. Start your search by specifying a data type
and location (the nation, a state, a town). Then choose a data format:
graphs, tables or downloadable files. You can also create your own bookmarks
when you want specific information again and again.
watersafety.usace.army.mil
The U.S. Army Corps of Engineers provides a one-stop shop for water safety
resources on its National Water Safety Program Web site. You can find
boater safety and swimming tips, tips on how to survive hypothermia should
an accident occur, and local contacts if you have a water safety question
or problem, or just want to check out the conditions of your local stream
before going kayaking. An interactive and fun page for kids and teachers,
Safe Passage, allows kids to learn water safety tips from characters Holly
and Jason, while solving the “riddle of the compass.” Parents
and teachers can access lesson plans, activity sheets and interactive
exercises in water safety, hydropower and conservation for grades K-6.
And if that’s not enough, link back to the U.S. Army Corps’
homepage for a wealth of information on ongoing and historical projects
and ways to get involved in your community, both locally and nationally.
Geologists create global Web site: www.onegeology.org
Perhaps no one knows better than
geologists how national boundaries conflict with science. So in partnership
with the U.N. International Year of Planet Earth, geologists around the
world are coming together to form a world geological map, accessible to
all on the Internet. The project is called OneGeology.
The brainchild of geologist Ian Jackson of the British Geological Survey,
OneGeology will be comparable to Google Earth, and perhaps even offered
through the dynamic map program, Jackson says. What will be different,
he says, is the wealth of information it will provide. “It will not
be an atlas, but a system on the Web for users,” adds Edward Derbyshire
of the University of London and chair of the Science Programme Committee
of the International Year of Planet Earth.
The map will be at a scale of 1:1,000,000, meaning it will show features
a kilometer in size or larger, a scale that participants agreed was the
most manageable to begin with, and would allow any country to participate.
As this project continues, the scale will reduce to a more detailed 1:100,000,
which will show features about the size of one street block.
The original goal of this project was to provide easy access to information
that was already out there, Jackson says. Traditionally, geological data
has not been easily exchangeable across countries. “I don’t
think people appreciate how much knowledge is out there,” he says.
The program works by allowing individual geological surveys and other
research bodies, such as polar and marine surveys, to upload their own
data to the dynamic geologic map as frequently as they want. The map will
thus reflect the most up-to-date data each participating body has.
By producing a geological world map, the participants of OneGeology hope
to create a geological standard, allowing lithologies and stratigraphies,
for example, to be easily understood from one nation to another. By providing
a harmonious dataset across countries and continents, nations around the
world will have access to information they have never had before, Jackson
says.
Research in the geosciences will be aided by having ready access to the
information provided by the global geological map. One of the benefits
of such a standard would be the ease of identifying deep geological structures
that might be used for the safe long-term storage of carbon dioxide, Jackson
says.
But the map can also benefit other fields such as engineering. For example,
engineers constructing a pipeline can look at the OneGeology map to find
information on bedrock structures that span national boundaries. And groundwater
movement and air and water pollution can be more easily tracked between
countries.
The project just kicked off this spring and is looking to build. To participate,
log on to www.onegeology.org.
For more about OneGeology, read the original story posted online March 28, 2007, in the Geotimes Web Extra archive at: www.geotimes.org/WebextraArchive.html.
In case you’re interested in learning more about the TV programs and projects we feature in the June 2005 issue of the magazine, we encourage you to check out the following Web sites.
YELLOWSTONE
- Yellowstone Volcano Observatory’s (YVO) excellent Q&A regarding Yellowstone and Supervolcano — the “real story” from the YVO scientists: volcanoes.usgs.gov/yvo/2005/docudrama.html
- YVO’s homepage, including ongoing monitoring activities in the park: volcanoes.usgs.gov/yvo
- BBC’s information about the making of Supervolcano, including photos from the program and some interactive activities: www.bbc.co.uk/sn/tvradio/programmes/supervolcano
- The Geological Society of London’s working group study on the effects of a supervolcano eruption: www.geolsoc.org.uk/template.cfm?name=Super1
DINOSAURS
- BBC’s detailed information on the making of Walking With Dinosaurs, including interviews with some of the producers and animators, scientific factoids on the dinosaurs included in the series, and games for kids to learn more: www.bbc.co.uk/dinosaurs
- Discovery Channel’s Web site devoted to all things dinosaur from its series Dinosaur Planet, including interactive activities where kids can learn all about the dinosaurs that roamed their neighborhoods: dsc.discovery.com/convergence/dinosaurplanet/dinosaurplanet.html
last updated 8/1/08
